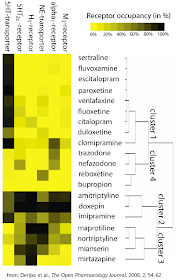
So the question is: How can we visualize what these drugs are doing, without reading long descriptions of their biological activities or trying to digest tables of receptor binding constants? Well, it turns out a team in the Netherlands has come up with an interesting way of visualizing antidepressant modes of action at a glance. It's shown in the graphic below.
Derijks et al. presented this nifty heatmap in "Visualizing Pharmacological Activities of Antidepressants: A Novel Approach," The Open Pharmacology Journal, 2008, 2, 54-62. They took the known binding constants for various antidepressants and calculated "receptor occupancies" for these drugs at the 5-HT (5-hydroxytryptamine; i.e. serotonin) reuptake transporter, 5-HT2c-receptor, histamine H1-receptor, norepinephrine reuptake transporter, alpha1-receptor, and muscarine M3-receptor, then subjected the results to principal component analysis to arrive at a hierarchical cluster scheme based on bioactivity homologies. What they found is that the 20 antidepressants they looked at grouped naturally into four main clusters. Within the clusters, drugs grouped together based (again) on similarity of activity at binding sites.
Basically, you can look at any given row in this picture as a kind of "barcode" (or fingerprint, if you like) for a particular drug based on its own particular mode(s) of action.
Buproprion (Wellbutrin) shows up as a solid yellow stripe, which might seem odd until you realize the Derijks group did not attempt to include dopamine-transporter occupancy in its model (nor did it look at nicotinic acetylcholine receptor binding, also important for bupropion). The group said they tried looking at dopamine transporter bindings but found it "did not change the overall classification in four clusters," so they left it out. For visualization purposes, it would have been nice if they'd left it in.
I think this kind of visual representation of drug activity is a very useful tool for differentiating antidepressants, and if psychiatrists (and nurse practitioners) knew about it they could use it to aid the decisionmaking process when it comes to trying a non-responsive patient on a different class of drug. If a drug from Cluster 1 doesn't work, it's only logical to try a drug from a different cluster rather than (say) a different drug from the same cluster.
In case you're having trouble with the generic drug names shown in the above figure, here's a table giving the translations between generic and trade names:
| Generic Name | Trade Name (and Category) |
| amitriptyline | Elavil, Saroten (TCA) |
| bupropion | Wellbutrin, Zyban |
| citalopram | Celexa, Cipramil (SSRI) |
| clomipramine | Anafranil (TCA) |
| doxepin | Adapine, Sinequan (TCA) |
| duloxetine | Cymbalta, Ariclaim (SNRI) |
| escitalopram | Lexapro, Cipralex (SSRI) |
| fluoxetine | Prozac, Sarafem (SSRI) |
| fluvoxamine | Luvox (SSRI) |
| imipramine | Tofranil (TCA) |
| maprotiline | Deprilept, Ludiomil (TCA) |
| mianserin | Bolvidon, Norval (TeCA) |
| mirtazapine | Remeron, Avanza (TeCA) |
| nefazodone | Serzone, Nefadar |
| nortriptyline | Aventyl, Pamelor (TCA) |
| paroxetine | Paxil, Seroxat (SSRI) |
| reboxetine | Edronax, Prolift (NRI) |
| sertraline | Zoloft, Lustral (SSRI) |
| trazodone | Desyrel, Deprax (SARI) |
| venlafaxine | Effexor (SNRI) |
SARI = Serotonin Antagonist and Reuptake Inhibitor
SNRI = Serotonin-Norepinephrine Reuptake Inhibitor
SSRI = Selective Serotonin Reuptake Inhibitor
TCA = Tricyclic Antidepressant
TeCA = Tetracyclic Antidepressant
