It's pretty easy to understand that every A on one strand of DNA pairs with a T on the other strand (and every G pairs with an opposite-strand C); this explains DNA complementarity and the associated replication model. But somewhere along the line, Chargaff was credited with the much less obvious rule that A = T and G = C even for individual strands of DNA that aren't paired with anything. This is the so-called second parity rule attributed to Chargaff, although I can't find any record of Chargaff himself having postulated such a rule. The Chargaff papers that are so often cited as supporting this rule (in particular the 3-paper series culminating in this report in PNAS) do not, in fact, offer such a rule, and if you read the papers carefully, what Chargaff and colleagues actually found was that one strand of DNA is heavier than the other (they label the strands 'H' and 'L', for Heavy and Light); not only that, but Chargaff et al. reported a consistent difference in purine content between strands (see Table 1 of this paper).
When I interviewed Linus Pauling in 1977, he cautioned me to always read the Results section of a paper carefully, because people will often conclude something entirely different than what the Results actually showed, or cite a paper as showing "ABC" when the data actually showed "XYZ."
How right he was.
At any rate, it turns out that the "message" strand of a gene hardly ever contains equal amounts of purines and pyrimidines. Codon analysis reveals that as genes become richer in A+T content (or as G+C content goes down), the excess of purines on the message strand becomes larger and larger. This is depicted in the following graph, which shows message-strand purine content (A+G) plotted against A+T content, for 1,373 distinct bacterial species. (No species is represented twice.)
 |
| Codon analysis reveals that as A+T content increases, message-strand purine content (A+G) increases. Each point on this graph represents a unique bacterial species (N=1373). |
It's quite obvious that when A+T content is above approximately 33%, as it is for most bacterial species, the message strand tends to be comparatively purine-rich. Below A+T = 33%, the message strand becomes more pyrimidine-rich than purine-rich. (Note: In bacteria, where most of the DNA is in coding regions, codon-derived A+T content is very close to whole-genome A+T content. I checked the 1,373 species graphed here and found whole-chromosome A+T to differ from codon-derived A+T by an average of less than 7 parts in 10,000.)
The correlation between A+T and purine content is strong (r=0.85). Still, you can see that quite a few points have drifted far from the regression line, especially in the region of x = 0.5 to x = 0.7, where lots of points lie above y = 0.55. What's going on with those organisms? I decided to do some investigating.
First, some basics. Over time, transition mutations (AT↔GC) can change an organism's A+T content and thus move it along the x-axis of the graph, but transitions cannot move an organism higher or lower on the graph, because (by definition) transitions don't affect the strandwise purine balance.
Transversions, on the other hand, can affect strandwise purine balance (in theory, at least), but only if they occur more often on one strand of DNA than the other. (I should say: occur more often, or are fixed more often, on one strand versus the other.) For example, let's say G-to-T transversions are the most common kind of transversion (which is probably true, given that guanine is the most easily oxidized of the four bases and given the fact that failure to repair 8-oxoguanine lesions does lead to eventual replacement with thymine). And let's say G-to-T transversions are most likely to occur on the non-transcribed strand of DNA, at transcription time. (The non-transcribed strand is uncoiled and unprotected while transcription is taking place on the other strand.) Over time, the non-transcribed strand would lose guanines; they'd be replaced by thymines. The message strand, or RNA-synonymous strand (which is also the non-transcribed strand) would become pyrimidine-rich and the other strand would become purine-rich.
Unfortunately, while that's exactly what happens for organisms with A+T content below 33%, precisely the opposite happens (purines accumulate on the message strand) in organisms with A+T above 33%. And in fact, in some high-AT organisms, the purine content of message strands is rather extreme. How can we explain that?
One possibility is that some organisms have evolved extremely effective transversion repair systems for the message (non-transcribed) strand of genes—systems that are so effective, no G-to-T transversions go unrepaired on the message strand. The transcribed strand, on the other hand, doesn't get the benefit of this repair system, possibly because the repair enzymes can't access the strand: it's engulfed in transcription factors, topoisomerases, RNA polymerase, nearby ribosomal machinery, etc.
If the non-transcribed strand never mutates (because all mutations are swiftly repaired), then the transcribed strand will (in the absence of equally effective repairs) eventually accumulate G-to-T mutations, and the message strand will accumulate adenines (purines). Perhaps.
In the graph further above, you'll notice at x = 0.6 a tiny spur of points hangs down at around y = 0.5. These points belong to some Bartonella species, plus a Parachlamydia and another chlamydial organism. These are endosymbionts that have lost a good portion of their genomes over time. It seems likely they've lost some transversion-repair machinery. During transcription, their message strands are going unrepaired. G-to-T transversions happen on the message strand, rendering it light in purines. Such a scenario seems plausible, at least.
By this reasoning, maybe points far above the regression line represent organisms that have gained repair functionality, such that their message strands never undergo G-to-T transversions (although their transcribed strands do). Is this possible?
Examination of the highest points on the graph shows a predominance of Clostridia. (Not just members of the genus Clostridium, but the class Clostridia, which is a large, ancient, and diverse class of anaerobes.) One thing we know about the Clostridia is that unlike all other bacteria (unlike members of the Gammaproteobacteria, the Alpha- and Betaproteobacteria, the Actinomycetes, the Bacteroidetes, etc.), the Clostridia have Ogg1, otherwise known as 8-oxoguanine glycosylase (which specifically prevents G-to-T transversions). They share this capability with all members of the Archaea, and all higher life forms as well.
Note that while non-Ogg1 enzymes exist for correcting 8-oxoguanine lesions (e.g., MutM, MutY, mfd), there is evidence that Ogg1 is specifically involved in repair of 8oxoG lesions in non-transcribed strands of DNA, at transcription time. (The other 8oxoG repair systems may not be strand-specific.)
If Archaea benefit from Ogg1 the way Clostridia do, they too should fall well above the regression line on a graph of A+G versus A+T. And this is exactly what we find. In the graph below, the pink squares are members of Archaea that came up positive in a protein-Blast query against Drosophila Ogg1. (I'll explain why I used Drosophila in a minute.) The red-orange circles are bacterial species (mostly from class Clostridia) that turned up Ogg1-positive in a similar Blast search.
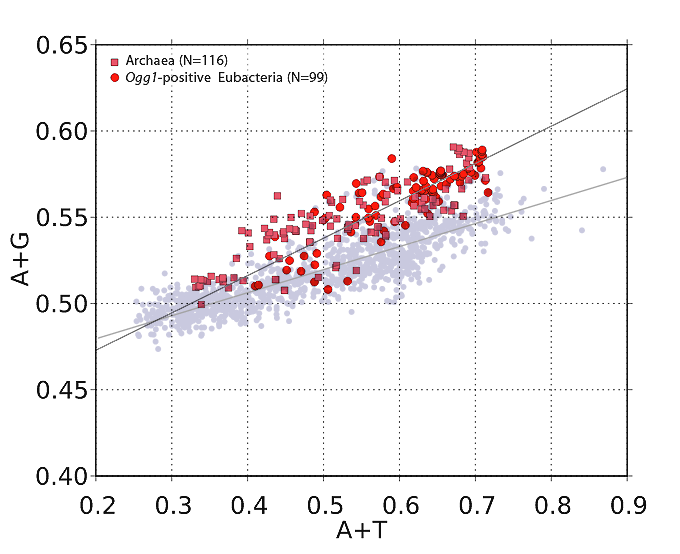 |
| Ogg1-positive organisms are plotted here. The pink squares are Archaea species. Red-orange circles are bacterial species that came up Ogg1-positive in a protein Blast search using a Drosophila Ogg1 amino-acid sequence. In the background (greyed out) is the graph of all 1,373 bacterial species, for comparison. Note how the Ogg1-positive organisms have a higher purine (A+G) content than the vast majority of bacteria. |
The points in this plot are significantly higher on the y-axis than points in the all-bacteria plot (and the regression line is steeper), consistent with a different DNA repair profile.
In identifying Ogg1-positive organisms, I wanted to avoid false positives (organisms with enzymes that share characteristics of Ogg1 but that aren't truly Ogg1), so for the Blast query I used Drosophila's Ogg1 as a reference enzyme, since it is well studied (unlike Archaeal or Clostridial Ogg1). I also set the E-value cutoff at 1e-10, to reduce spurious matches with DNA repair enzymes or nucleases that might have domain similarity with Ogg1 but aren't Ogg1. In addition, I did spot checks to be sure the putative Ogg1 matches that came up were not actually matches of Fpg (MutM), RecA, RadA, MutY, DNA-3-methyladenine glycosidase, or other DNA-binding enzymes.
Bottom line, organisms that have an Archaeal 8-oxoguanine glycosylase enzyme (mostly obligate anaerobes) occupy a unique part of the A+G vs. A+T graph. Which makes sense. It's only logical that anaerobes would have different DNA repair strategies (and a different "repairosome") than oxygen-tolerant bacteria, because oxidative stress is, in general, handled much differently in anaerobes. The fact that they bring different repair tactics to bear on DNA shouldn't come as a surprise.