One reason genomes are so poorly annotated is that annotation software (of the Glimmer variety) gets easily confused by high-GC-content genome data. When a genome is high in guanine and cytosine, relatively few stop codons are present in alternate reading frames. (Recall that DNA is read in triplets of letters, called codons: AAA, AAC, AAT, AGT, etc. There are 6 possible reading frames for any given segment of DNA, representing 3 forward reading frames and 3 backward frames.) Stop codons (TGA, TAG, TAA) are mostly composed of A and T, not G and C. But also, it so happens that most protein-coding genes follow a certain pattern of codon construction. The first base in a 3-letter codon is usually A or G (about 60% of the time, in most genes, in most organisms). The second base is highly variable in all respects. The third base is usually reflective of overall genome composition: If the genome is high in G and C, the third base of each codon will tend to be G or C. (This happens almost all the time in Streptomyces, for example, where the third base G+C content is 97%.) If the genome is high in A and T, the third codon base will be high in A and T.
What's perhaps unexpected is that the same compositional pattern can sometimes work in reverse, on the complementing DNA strand. When you look at a protein's codons and see that 60% use a purine in the first base and but only 40% use a purine in the third base, this means that the reverse complement of the codon also has 60% purine content in base one and 40% purine content in base three. Example: the codon GCT (alanine) has a purine (G) followed by a pyrimidine (C) followed by a pyrimidine. The reverse complement codon, AGC (serine) also begins with a purine (A) and ends with a pyrimidine (C). This type of symmetry tends to be a confounding factor for programs like Glimmer that try to distinguish sense from antisense strands and coding from non-coding regions, and normal reading frames from nonsense frames.
Perhaps some real-world data will make this clearer. Below is a plot of AG1 (purine content at base one) versus GC1 (guanine plus cytosine, base one) for all codons of all genes of the soil bacterium Pseudomonas fluorescens PF0-1. Each point represents one gene's worth of data. For each data point, I simply went through all of that gene's codons and tallied up the A, G, C, and T at each base position, then found the average AG1 and GC1 for the gene in question. I did this for all 5,722 protein-coding genes in the genome. (Don't worry. Scripts do the whole thing in the blink of an eye. It takes less than 10 milliseconds to process one gene's worth of data.) Notice how the points cluster at y=0.6, meaning most genes have an average AG1 (first-base purine) content of around 60%.
Now have a look at the graph below, which is the same kind of plot except we're looking at data for the third codon base. Here, the median y-value is only 0.453, meaning that purine content averages around 45% in the third base. That means on the opposite strand, in the same position, there's a purine ~55% of the time.
I ran some numbers and found that in P. fluorescens, 74% of genes have codons that are purine-heavy on the front (AG1 greater than 55%), in the normal reading direction, but most genes (53%) are also purine-heavy in base one when read in the reverse-complement sense. In fact, for every three protein genes that have AG1 greater than 55% and GC3 above 60% in the normal reading frame, there are two genes that meet the same criteria when translated in the reverse-complement frame. This means that for quite a few genes in Pseudomonas, the normal reading frame has similar compositional statistics to the reverse reading frame. (Note that codon base two tends to average 48% purines in the forward direction and 52% in the back direction.) To a program like Glimmer, many protein genes look surprisingly similar whether read from the sense strand of DNA or the antisense strand. Distinguishing sense from antisense is not trivial, in other words, although in an upcoming post I'll talk about a way to do it via codon bias.
To get a better idea of how universal this bidirectional codon symmetry might be, I obtained the codon statistics for 109 organisms and calculated the average base-3 composition stats, and came up with the following graph that plots AG3 (purines, base three) against overall genome A+T content:
The size of each circle is proportional to the genome size of the organism in question. (As you can see, organisms with high genomic A+T content often tend to have smaller genomes.) Notice that base three tends to be a pyrimidine (AG3 less than 50%), in the normal reading frame, for almost all organisms. (That means it's a purine in the reverse reading frame.) A few circles appear above y=0.5, but not many, and not by much.
Bottom line: Distinguishing sense from antisense DNA is not a straightforward matter, since many codons have similar composition statistics in forward and backward frames. Breaking the deadlock might require finding a Shine Dalgarno sequence for one frame but not the other, or it could mean running a homology check (via BLAST) against similar genes in a database, but in that case you have to hope the strand assignment was correct in the database genes (which it often is not).
Incidentally, I know of no a priori reason why the wobble base should accumulate pyrimidines preferentially (even though that's what the data say). In theory, base three is (for most codons) a degenerate position and should be neutral (free to accumulate bases of any type). We know that base one tends to be a purine 60% of the time. The fact that base three is a pyrimidine 54.7% of the time is suspicious (arguably) and tends to imply that some genes are annotated backwards. As we'll see in a future post, the backwards-annotation problem isn't a huge issue in most organisms, but it's not negligible, either.
Showing posts with label purine loading. Show all posts
Sunday, May 11, 2014
Tuesday, April 08, 2014
Why do so many codons begin with a purine?
With the advent of sites like genomevolution.org (where you can download genomes, create synteny graphs, run BLAST searches, and do all sorts of desktop bioinformatics), it's ridiculously easy for someone interested in comparative genomics to . . . well, compare genomes, for one thing. And if you look at enough gene sequences, a couple of things pop out.
One thing that pops out is that most codons, in most genes, begin with a purine (namely A or G: adenine or guanine). Also, codons typically show the greatest GC swing in base number three. These trends can be seen in the chart below, where I show average base composition (by codon position) for three well-studied organisms. For clarity, base-one purines are shown in bold and base-three G and C are shown highlighted in yellow.
Streptomyces griseus is a common soil bacterium that happens to have very high genomic G+C content (72.1% overall, although you can see that in base three of codons the G+C content is more like 92%).
E. coli represents a middle-of-the-road organism in terms of G+C content (50.8% overall), while our ugly friend Clostridium botulinum (the soil organism that can ruin your whole day if it finds its way into a can of tomatoes) has very low genomic G+C content (around 28%).
Even though these organisms differ greatly in G+C content, they all illustrate the (universal) trend toward usage of purines (A or G) in the first position of a codon. Something like 59% to 69% of the time (depending on the organism), codons look like Pnn, where P is a purine base and 'n' represents any base. This is true for viruses as well as cellular genomes.
This pattern is so universal, one wonders why it exists. I think a credible, parsimonious explanation is that when protein-coding genes look like PnnPnnPnn... (etc.) it makes for a crisp reading frame. It's easy to see that a +1 frameshift results in a repeating nPn pattern and a +2 frameshift results in repeats of nnP. These are easily distinguished from Pnn.
There are benefits for a PnnPnnPnn... reading frame. In a previous post, I showed that when most of a gene's codons have a pyrimidine in base two, the resulting protein gets shipped to the cell membrane. (This is a simple consequence of the fact that codons with a pyrimidine in position two tend to code for hydrophobic, lipid-soluble amino acids.) Because a +1 reading-frame shift produces repeats of nPn, the Pnn "default" pattern means that +1 frameshifted gene products, if they occur, won't get shipped to the cell membrane. This is an extremely important outcome, because membrane proteins are, in general, highly transcribed and under strong selective pressure. In addition to specifying antigenic properties and determining phage resistance, membrane proteins make up proton pumps, secretion systems, symporters, kinases, flagellar components, and many other kinds of proteins. They determine the cell's "interface" to the world. They also maintain cell osmolarity and membrane redox potential. Messing with membrane proteins is bound to be risky. Much better to keep frameshifted nonsense proteins away from the membrane.
Fairly strong support for this notion (that Pnn codons provide a crisp reading frame) comes from studies of naturally occurring frameshift signals in DNA. We now know that in many organisms, certain "slippery" DNA signals (usually heptamers, like CCCTGAC) instruct the ribosome to change reading frames. (See, for example, "A Gripping Tale of Ribosomal Frameshifting: Extragenic Suppressors of Frameshift Mutations Spotlight P-Site Realignment," Atkins and Björk, Microbiol. Mol. Biol. Rev. 2009. Also, for fun, be sure to check out some of the papers on quadruplet decoding, which leaves room for alien life forms with 200 amino acids instead of 20.) The "slippery heptamer" frameshift signals that have thus far been identified tend to contain runs of pyrimidines.
Also tending to support the "Pnn = crisp reading frame" notion is the fact that stop codons (TGA, TAA, TAG) look like pPP (where 'p' is a pyrimidine and 'P' is a purine). Again, a crisp distinction.
As for why purines were chosen (and not pyrimidines) to begin the Xxx pattern, again I think a fairly parsimonious answer is available: ATP and GTP are the most abundant nucleoside-triphosphates in vivo. These are the energy sources for nucleic-acid and protein synthesis, respectively.
A prediction: If we run into an alien life form (in the oceans of Europa, say) and it turns out to be the case that UTP (instead of ATP) is the "universal energy molecule" in that life form's cells, then that life form's codons will probably begin with U and form Unn triplets (or Unnn quadruplets, perhaps) a higher-than-average percentage of the time.
One thing that pops out is that most codons, in most genes, begin with a purine (namely A or G: adenine or guanine). Also, codons typically show the greatest GC swing in base number three. These trends can be seen in the chart below, where I show average base composition (by codon position) for three well-studied organisms. For clarity, base-one purines are shown in bold and base-three G and C are shown highlighted in yellow.
Organism
|
Codon
base
|
A
|
G
|
C
|
T
|
| S. griseus |
1
|
0.166 | 0.434 | 0.287 | 0.112 |
2
|
0.224 | 0.219 | 0.295 | 0.261 | |
3
|
0.037 | 0.394 | 0.530 | 0.038 | |
| E. coli |
1
|
0.256 | 0.343 | 0.238 | 0.161 |
2
|
0.291 | 0.181 | 0.222 | 0.304 | |
3
|
0.186 | 0.285 | 0.261 | 0.265 | |
| C. botulinum |
1
|
0.395 | 0.299 | 0.094 | 0.210 |
2
|
0.374 | 0.136 | 0.161 | 0.328 | |
3
|
0.442 | 0.108 | 0.064 | 0.383 |
Streptomyces griseus is a common soil bacterium that happens to have very high genomic G+C content (72.1% overall, although you can see that in base three of codons the G+C content is more like 92%).
E. coli represents a middle-of-the-road organism in terms of G+C content (50.8% overall), while our ugly friend Clostridium botulinum (the soil organism that can ruin your whole day if it finds its way into a can of tomatoes) has very low genomic G+C content (around 28%).
Even though these organisms differ greatly in G+C content, they all illustrate the (universal) trend toward usage of purines (A or G) in the first position of a codon. Something like 59% to 69% of the time (depending on the organism), codons look like Pnn, where P is a purine base and 'n' represents any base. This is true for viruses as well as cellular genomes.
This pattern is so universal, one wonders why it exists. I think a credible, parsimonious explanation is that when protein-coding genes look like PnnPnnPnn... (etc.) it makes for a crisp reading frame. It's easy to see that a +1 frameshift results in a repeating nPn pattern and a +2 frameshift results in repeats of nnP. These are easily distinguished from Pnn.
There are benefits for a PnnPnnPnn... reading frame. In a previous post, I showed that when most of a gene's codons have a pyrimidine in base two, the resulting protein gets shipped to the cell membrane. (This is a simple consequence of the fact that codons with a pyrimidine in position two tend to code for hydrophobic, lipid-soluble amino acids.) Because a +1 reading-frame shift produces repeats of nPn, the Pnn "default" pattern means that +1 frameshifted gene products, if they occur, won't get shipped to the cell membrane. This is an extremely important outcome, because membrane proteins are, in general, highly transcribed and under strong selective pressure. In addition to specifying antigenic properties and determining phage resistance, membrane proteins make up proton pumps, secretion systems, symporters, kinases, flagellar components, and many other kinds of proteins. They determine the cell's "interface" to the world. They also maintain cell osmolarity and membrane redox potential. Messing with membrane proteins is bound to be risky. Much better to keep frameshifted nonsense proteins away from the membrane.
Fairly strong support for this notion (that Pnn codons provide a crisp reading frame) comes from studies of naturally occurring frameshift signals in DNA. We now know that in many organisms, certain "slippery" DNA signals (usually heptamers, like CCCTGAC) instruct the ribosome to change reading frames. (See, for example, "A Gripping Tale of Ribosomal Frameshifting: Extragenic Suppressors of Frameshift Mutations Spotlight P-Site Realignment," Atkins and Björk, Microbiol. Mol. Biol. Rev. 2009. Also, for fun, be sure to check out some of the papers on quadruplet decoding, which leaves room for alien life forms with 200 amino acids instead of 20.) The "slippery heptamer" frameshift signals that have thus far been identified tend to contain runs of pyrimidines.
Also tending to support the "Pnn = crisp reading frame" notion is the fact that stop codons (TGA, TAA, TAG) look like pPP (where 'p' is a pyrimidine and 'P' is a purine). Again, a crisp distinction.
As for why purines were chosen (and not pyrimidines) to begin the Xxx pattern, again I think a fairly parsimonious answer is available: ATP and GTP are the most abundant nucleoside-triphosphates in vivo. These are the energy sources for nucleic-acid and protein synthesis, respectively.
A prediction: If we run into an alien life form (in the oceans of Europa, say) and it turns out to be the case that UTP (instead of ATP) is the "universal energy molecule" in that life form's cells, then that life form's codons will probably begin with U and form Unn triplets (or Unnn quadruplets, perhaps) a higher-than-average percentage of the time.
Saturday, April 05, 2014
The first base in a codon is usually a purine
In my earlier post on the leprosy bacterium (Mycobacterium leprae), I showed some colorful graphs of DNA base composition, and I showed how the compositional statistics vary non-randomly according to codon base position. If you're not a biogeek, what you need to know here is the following (Bioinformatics in Sixty Seconds):
An example of an organism with very high G+C content in its genome is the common soil bacterium Streptomyces griseus, with 72% G+C. In bacteria, genome G+C content correlates loosely (r=0.46) with genome size, and sure enough, the genome of S. griseus is on the portly side, with 7265 genes encoded in 8.7 million base-pairs of DNA. Just for fun, I created a graph (below) that shows how DNA base content varies according to codon base position. Relative purine content (A+G) is plotted on the y-axis; G+C content is on the x-axis. Each dot represents one gene's statistics. (For every gene, I tallied the average purine usage in all the gene's codons, and the average G+C content, at each codon base position.) Red dots are for the first base in a codon. Gold dots are for base two. Blue dots are for base three.
Notice how the blue dots (representing base three) slam up against the right edge of the graph. The data points look as if they're cut off or something, but they're not! The "jammed up" appearance is the result of base three having an extremely high G+C content in Streptomyes, coming very close to the theoretical maximum of 100% in many genes. This is nothing unusual. In organisms with high-GC genomes, the third codon position is usually very, very high in G+C, while in organisms with low-GC genomes, the "wobble base" (as it's sometimes called) is usually extraordinarily rich in A+T. The third codon position is, to a large extent, informationally redundant (due to codon degeneracy) and so the choice of base here usually corresponds to G or C if the genome is characteristically GC-rich, or A or T if the genome is AT-rich.
Unlike position three, the first base in a codon is highly significant, informationally, and is subject to strong selection pressure. Notice how the red dots cluster fairly high on the graph (median: y=0.5957, plus or minus 0.0497 SD). It means most codons begin with a purine (A or G). Don't ask me how or why nature made this choice. The choice is pretty clear, though. Sixty percent of the time, you'll find A or G in position one. In some genes, it's more like 75%; very few are under 50%.
Base two (gold dots) shows a relaxation of G+C preference (median: x=0.5139) and a reduced tendency for purine usage (median: y=0.4475), but you'll notice, if you look closely, that there's a secondary cloud of gold points under the main cloud. This secondary cloud of points has a special significance, which I'll talk about in my next post.
To complement the above graph, I thought it might be fun to do the same sort of analysis on a genome containing conspicuously low G+C content. For this, I chose Clostridium botulinum (Hall strain), which has a genomic G+C content of just 28.2%. The botulinum genome encodes 3404 genes in 3.7 million base-pairs of DNA. Like S. griseus, C. botulinum can be found in soil, but unlike Streptomyces (which is aerobic), members of the Clostridiales are famously anaerobic and find oxygen downright intolerable (not that it matters for this analysis, however).
When we look at base compositions in various codon positions for the 3404 coding regions of C. botulinum DNA, we get the following graph:
Here, notice that the blue dots are way over to the left, reflecting the organism's preference for a very low overall genomic G+C content. Base two (gold points) is not quite as GC-extreme. But notice where the red dots are clustering: They're quite high on the graph, at a median y-value of 0.6956, with very few data points falling below 0.6. The preference for a purine in codon position one is very strong in C. botulinum.
If you look carefully, you can see (once again) a tiny "breakaway group" of gold dots underneath the main cloud of gold (base two) data points. This has a special significance; I'll explain it in my next post.
In sum: Two features of codon base composition are highly general and apply across organisms (and across domains of life). First: The third ("wobble") base has the most extreme G+C content, biased toward high G+C (if the organism has characteristically high genomic GC content) or toward low G+C (if the organism has a low-GC genome). Second: The base in codon position one tends to be a purine in most codons, in most proteins, in most organisms, most of the time. The first rule is easy to explain: low information content and low selection pressure allow an organism to put whatever base is most convenient (whatever's lying around handy, you might say) in the "wobble" position. The second rule is harder to explain. Nature simply prefers a purine in the first position of a codon.
Genomes (from the National Center for Biotechnology Information) were downloaded from http://genomevolution.org on April 1, 2014. Data processing was done with custom scripts (written in JavaScript). Graphs (and statistics) were generated using the excellent service at ZunZun.com.
- Genes encode information in a linear sequence of the four DNA bases A, G, C, and T (adenine, guanine, cytosine, and thymine). A and G are purines. C and T are pyrimidines.
- The sequence on one strand of DNA is complementary to the sequence on the opposite strand of DNA. (G pairs with C and A pairs with T, so that if one stand contains the message GGTCA, the opposite strand will contain CCAGT.) The fact that G pairs with C and A pairs with T was figured out by Erwin Chargaff in the early 1950s. Watson and Crick deduced the double helix structure of DNA shortly thereafter.
- Genes are said to have a message strand and a complementary "transcribed strand." The transcribed strand is used as a template to create RNA with the same sequence as the message strand, except thymine (T) is replaced by uracil (U) in RNA.
- If a gene encodes a protein (as most genes do), the associated RNA will ultimately be parsed three bases at a time to determine how to encode the protein. The three-base "words" in DNA/RNA are called codons.
- There are 64 possible codons. They map to 20 amino acids. Some amino acids have as many as six synonymous codons; others have just one.
An example of an organism with very high G+C content in its genome is the common soil bacterium Streptomyces griseus, with 72% G+C. In bacteria, genome G+C content correlates loosely (r=0.46) with genome size, and sure enough, the genome of S. griseus is on the portly side, with 7265 genes encoded in 8.7 million base-pairs of DNA. Just for fun, I created a graph (below) that shows how DNA base content varies according to codon base position. Relative purine content (A+G) is plotted on the y-axis; G+C content is on the x-axis. Each dot represents one gene's statistics. (For every gene, I tallied the average purine usage in all the gene's codons, and the average G+C content, at each codon base position.) Red dots are for the first base in a codon. Gold dots are for base two. Blue dots are for base three.
Notice how the blue dots (representing base three) slam up against the right edge of the graph. The data points look as if they're cut off or something, but they're not! The "jammed up" appearance is the result of base three having an extremely high G+C content in Streptomyes, coming very close to the theoretical maximum of 100% in many genes. This is nothing unusual. In organisms with high-GC genomes, the third codon position is usually very, very high in G+C, while in organisms with low-GC genomes, the "wobble base" (as it's sometimes called) is usually extraordinarily rich in A+T. The third codon position is, to a large extent, informationally redundant (due to codon degeneracy) and so the choice of base here usually corresponds to G or C if the genome is characteristically GC-rich, or A or T if the genome is AT-rich.
Unlike position three, the first base in a codon is highly significant, informationally, and is subject to strong selection pressure. Notice how the red dots cluster fairly high on the graph (median: y=0.5957, plus or minus 0.0497 SD). It means most codons begin with a purine (A or G). Don't ask me how or why nature made this choice. The choice is pretty clear, though. Sixty percent of the time, you'll find A or G in position one. In some genes, it's more like 75%; very few are under 50%.
Base two (gold dots) shows a relaxation of G+C preference (median: x=0.5139) and a reduced tendency for purine usage (median: y=0.4475), but you'll notice, if you look closely, that there's a secondary cloud of gold points under the main cloud. This secondary cloud of points has a special significance, which I'll talk about in my next post.
To complement the above graph, I thought it might be fun to do the same sort of analysis on a genome containing conspicuously low G+C content. For this, I chose Clostridium botulinum (Hall strain), which has a genomic G+C content of just 28.2%. The botulinum genome encodes 3404 genes in 3.7 million base-pairs of DNA. Like S. griseus, C. botulinum can be found in soil, but unlike Streptomyces (which is aerobic), members of the Clostridiales are famously anaerobic and find oxygen downright intolerable (not that it matters for this analysis, however).
When we look at base compositions in various codon positions for the 3404 coding regions of C. botulinum DNA, we get the following graph:
Here, notice that the blue dots are way over to the left, reflecting the organism's preference for a very low overall genomic G+C content. Base two (gold points) is not quite as GC-extreme. But notice where the red dots are clustering: They're quite high on the graph, at a median y-value of 0.6956, with very few data points falling below 0.6. The preference for a purine in codon position one is very strong in C. botulinum.
If you look carefully, you can see (once again) a tiny "breakaway group" of gold dots underneath the main cloud of gold (base two) data points. This has a special significance; I'll explain it in my next post.
In sum: Two features of codon base composition are highly general and apply across organisms (and across domains of life). First: The third ("wobble") base has the most extreme G+C content, biased toward high G+C (if the organism has characteristically high genomic GC content) or toward low G+C (if the organism has a low-GC genome). Second: The base in codon position one tends to be a purine in most codons, in most proteins, in most organisms, most of the time. The first rule is easy to explain: low information content and low selection pressure allow an organism to put whatever base is most convenient (whatever's lying around handy, you might say) in the "wobble" position. The second rule is harder to explain. Nature simply prefers a purine in the first position of a codon.
Genomes (from the National Center for Biotechnology Information) were downloaded from http://genomevolution.org on April 1, 2014. Data processing was done with custom scripts (written in JavaScript). Graphs (and statistics) were generated using the excellent service at ZunZun.com.
Saturday, July 20, 2013
More about Mitochondrial DNA
To recap my desktop-science experiments of the last month or so, I've found strandwise DNA asymmetry across domains, which is to say in bacteria, Archaea, eukaryotes, viruses, and mitochondrial DNA. In every case except mitochondria, the message (or RNA-synonymous) strand of DNA in coding regions tends to be purine-rich. The opposite strand tends to be pyrimidine-rich. Moreover, in all domains, including mitochondria, message-strand purine content increases in proportion to genome A+T content. (A+T content is a phylogenetic signature. Some genomes are inherently high in A+T content—or low in G+C content—while others are not. Related organisms tend to have similar A+T or G+C contents.)
Mitochondrial genes tend to be pyrmidine-rich on the message strand, seemingly in violation of the finding that in all other domains, message strands are purine-rich. The mitochondrial anomaly is actually very easy to understand (although it took me weeks to realize the explanation). In a nutshell: Mitochondrial DNA is pyrimidine-rich on message strands because mtDNA encodes only a few proteins (13, usually), all of them membrane-associated. Membrane-associated proteins are unusual because they tend to incorporate mostly non-polar amino acids such as leucine, isoleucine, valine, proline, alanine, or phenylalanine—all of which are specified by pyrimidine-rich codons.
It seems to me mitochondrial DNA shouldn't be thought of as a genome, because well over 90% of mitochondrial-associated gene products are encoded by genes in the host nucleus. (In humans, there may be as many as 1500 nuclear-encoded mitochondrial genes.) This point is worth repeating, so let me quote Patrick Chinnery, TRENDS in Genetics (2003) 19:2, 60:
The circular mitochondrial "chromosome" (if it can be called that) is the vestigial remnant of a much larger genome that long ago migrated to the host nucleus, no doubt to avoid oxidative attack. The mitochondrion simply is not a safe place to store DNA. (Would you set up a sperm bank in a rocket-fuel factory?) It's teeming with molecular oxygen, superoxides, peroxides, free protons, and other hazardous materials.
Human mitochondrial DNA (which is typical of a lot of mtDNA) encodes just a handful of multi-subnit transmembrane proteins, namely: cytochrome-c oxidase, NADH dehydrogenase, cytochrome-b, and an ATPase. That's it. There are no other protein genes in human mtDNA. All other "mitochondrial proteins" are encoded somewhere else. (That includes 37 out of 44 subunits of the NADH dehydrogenase complex; the DNA polymerase that replicates mitochondrial DNA; the mitochondrial RNA polymerase; about 50 ribosomal proteins; so-called "mitochondrial" catalase; and hundreds of other "mitochondrial" proteins. All are encoded in the nucleus.)
Bottom line: Mitochondrial DNA encodes a very small ensemble of highly specialized membrane-associated proteins. We shouldn't expect this small ensemble to be representative of other genes found in other genomes. (And it's not.) That, in a nutshell, is why mtDNA is not particularly purine-rich in message strands.
But we should test this hypothesis, if possible. (And it is, in fact, possible.) Most bacteria are aerobic, which means most bacterial species have genes for cytochrome-c oxidase, NADH dehydrogenase, etc. The DNA for those genes should be similar to mtDNA with respect to strand-asymmetric purine content. If we analyze bacterial DNA, we should find that genes for cytochrome-c oxidase, NADH dehydrogenase, etc. are pyrimidine-rich on the message strand, just as in mtDNA.
In tomorrow's post: the data.
Mitochondrial genes tend to be pyrmidine-rich on the message strand, seemingly in violation of the finding that in all other domains, message strands are purine-rich. The mitochondrial anomaly is actually very easy to understand (although it took me weeks to realize the explanation). In a nutshell: Mitochondrial DNA is pyrimidine-rich on message strands because mtDNA encodes only a few proteins (13, usually), all of them membrane-associated. Membrane-associated proteins are unusual because they tend to incorporate mostly non-polar amino acids such as leucine, isoleucine, valine, proline, alanine, or phenylalanine—all of which are specified by pyrimidine-rich codons.
![]() |
| The mitochondrion. |
It seems to me mitochondrial DNA shouldn't be thought of as a genome, because well over 90% of mitochondrial-associated gene products are encoded by genes in the host nucleus. (In humans, there may be as many as 1500 nuclear-encoded mitochondrial genes.) This point is worth repeating, so let me quote Patrick Chinnery, TRENDS in Genetics (2003) 19:2, 60:
The vast majority of mitochondrial proteins (estimated at >1000) are synthesized in the cytosol from nuclear gene transcripts.
The circular mitochondrial "chromosome" (if it can be called that) is the vestigial remnant of a much larger genome that long ago migrated to the host nucleus, no doubt to avoid oxidative attack. The mitochondrion simply is not a safe place to store DNA. (Would you set up a sperm bank in a rocket-fuel factory?) It's teeming with molecular oxygen, superoxides, peroxides, free protons, and other hazardous materials.
![]() |
| The human mitochondrial chromosome. |
Human mitochondrial DNA (which is typical of a lot of mtDNA) encodes just a handful of multi-subnit transmembrane proteins, namely: cytochrome-c oxidase, NADH dehydrogenase, cytochrome-b, and an ATPase. That's it. There are no other protein genes in human mtDNA. All other "mitochondrial proteins" are encoded somewhere else. (That includes 37 out of 44 subunits of the NADH dehydrogenase complex; the DNA polymerase that replicates mitochondrial DNA; the mitochondrial RNA polymerase; about 50 ribosomal proteins; so-called "mitochondrial" catalase; and hundreds of other "mitochondrial" proteins. All are encoded in the nucleus.)
Bottom line: Mitochondrial DNA encodes a very small ensemble of highly specialized membrane-associated proteins. We shouldn't expect this small ensemble to be representative of other genes found in other genomes. (And it's not.) That, in a nutshell, is why mtDNA is not particularly purine-rich in message strands.
But we should test this hypothesis, if possible. (And it is, in fact, possible.) Most bacteria are aerobic, which means most bacterial species have genes for cytochrome-c oxidase, NADH dehydrogenase, etc. The DNA for those genes should be similar to mtDNA with respect to strand-asymmetric purine content. If we analyze bacterial DNA, we should find that genes for cytochrome-c oxidase, NADH dehydrogenase, etc. are pyrimidine-rich on the message strand, just as in mtDNA.
In tomorrow's post: the data.
Friday, July 19, 2013
Strand Asymmetry in Mitochondrial DNA
Funny how the availability of so much free DNA data can go to your head. When I learned that DNA sequence data for more than 2,000 mitochondrial genomes could be accessed, free, at genomevolution.org, I couldn't resist: I wrote some scripts that checked the DNA composition of 2,543 mtDNA (mitochondrial DNA) sequences. What I found blew me away.
If you're a biologist, you're accustomed to thinking of genome G+C (guanine plus cytosine) content as a kind of phylogenetic signature. (Related organisms usually have G+C values that are fairly close to one another.) For purposes of the following discussion, I'm going to reference A+T content, which is, of course, just one-minus-GC. (A GC content of 0.25, or 25%, means the AT content is 0.75, or 75%).
What I learned is that mitochondrial DNA shows strand asymmetry in coding regions (regions that actually get transcribed to RNA, as opposed to non-coding "control" regions and junk DNA). In particular, it shows an excess of pyrimidines (T and C) on the "message strand." This is the exact opposite of the situation in Archaea and bacteria, where message strands tend to accumulate purines (G and A).
The interesting thing is, just like bacteria (and Archaea), mitochondrial genomes tend to show a steady, predictable rate of increase of purines on the message strand with increasing A+T, even though purines are outnumbered by pyrimidines on the message strand. A picture might make this clearer:
Every point in this graph represents a mitochondrial genome (2,543 in all). As you can see, the regression line (which minimizes the sum of squared error) is upward-sloping, with a rise of 0.149, meaning that for every 10% increase in genome A+T content, there's a corresponding 1.49% increase in message-strand purine (A+G) content. What's striking about this is that in a similar graph for 1,373 bacterial genomes (see this post), the regression-line slope turned out to be 0.148. Chargaff's second parity law predicts a straight horizontal line at y=0.5. Obviously that law is kaput.
I've written before about my repeated finding (in bacteria, Archaea, eukaryotes, viruses, bacteriophage; basically every place I look) that message-strand purine content accumulates in proportion to genome A+T content. Strand asymmetry with respect to purines and pyrimidines seems to be universal. But why?
Strand-asymmetric buildup of purines or pyrimidines is very hard to explain without invoking either a theory of strand-asymmetric DNA repair or a theory of strand-asymmetric mutagenesis, or both. Is it reasonable to suppose that one strand of DNA is more vulnerable to mutagenesis than another? Yes, if you accept that in a growing cell, the strands spend a good portion of their time apart (during transcription and replication). Neither replication nor transcription is symmetric in implementation. I'll spare you the details for the replication side of the argument, but suffice it to say, replication-related asymmetries are not likely (in my opinion) to be behind the purine/pyrminidine strand asymmetries I've been documenting. What we're seeing, I think, is the result of asymmetric repair at transcription time.
During transcription, a gene's DNA strands are separated. One strand is used as a template by RNA polymerase to create messenger RNA and ribosomal RNA. The other strand is free and floppy and vulnerable to attack by mutagens. But it's also readily accessible to repair enzymes.
The above diagram oversimplifies things considerably, but I include it for the benefit of non-biogeeks who might want to follow this argument through. Note that DNA strands have directionality: the sugar bonds face one way in one strand and the other way in the other strand. This is denoted by the so-called 5'-to'3 orientation of strands.(RNAP = RNA polymerase.)
DNA repair is a complex subject. Be assured, every cell, of every kind, has dozens of different kinds of enzymes devoted to DNA repair. Without these enzymes, life as we know it would end, because DNA is constantly undergoing attack and requiring repair.
Some types of repair take place in double-stranded DNA (that is, DNA that is not undergoing replication or transcription). Other types of repair apply to single-stranded DNA. In bacteria as well as higher life forms, there's a transcription-coupled repair system (TCRS) that comes into play when RNA polymerase is stalled by thymine dimers or other DNA damage. This remarkably elaborate system changes out short sections of damaged DNA (at considerable energy cost). Because it involves replacing whole nucleotides (sugar and all), it's categorized as a Nucleotide Execision Repair system (NER). The alternative to NER is Base Excision Repair (BER), which is where a defective base (usually an oxidized guanine) gets snipped out without removing any sugars from the DNA backbone. The enzymes that perform this base-clipping are generically known as glycosylases.
For many years, it was thought that mitochondria did not have DNA repair systems. We now know that's not true. Mitochondrial DNA is subject to constant oxidative attack and it turns out the damage is quickly repaired, in double-stranded DNA. Evidence for repair of single-stranded mtDNA is scant. Those who have looked for a transcription-coupled repair system (or indeed any NER system) in mitochondria have not found one. Mitochondrial BER repair (via Ogg1) does exist, but it seems to operate when the DNA is double-stranded, not during transcription. This makes sense, because for BER to finish, the strand must be nicked by AP endonuclease after the bad base is popped out, then the repair proceeds by matching the opposing base (opposite the abasic site) using the other strand as template. In Clostridia and Archaea (which have an Ogg enzyme that other bacteria do not have; see this post and this paper), Ogg1 can pop out a bad base while the DNA is single-stranded; Ogg1 then binds to the abasic site and is only released by AP endonuclease when it arrives later on.
Bottom line, we know that mitochondrial DNA spends much of its time in the unwound state (because mtDNA products are very highly transcribed) and that the non-transcribed DNA strand is extremely vulnerable to oxidative attack. (The template strand is less vulnerable, because it is cloaked in enzymes: RNA polymerase, transcription factors, ribosomes, etc.) We also know that 8-oxoguanine is the most prevalent form of oxidative damage in mtDNA and that, uncorrected, such damage leads to G-to-T transversion. The finding of consistently high pyrimidine content in the message strand of mitochondrial DNA (see graph further above) is consistent with a slower rate of repair of the non-transcribed strand, and the differential occurrence of G-to-T transversions on that strand. Or at least, that's a possible explanation of the pyrimidine richness of the message strand of mtDNA.
But there are additional factors to consider, such as selection pressure. Mitochondrial DNA tends to encode membrane-associated proteins, and membrane proteins use nonpolar amino acids, which are (in turn) predominantly encoded by pyrimidine-rich codons. More about this in an upcoming post.
If you're a biologist, you're accustomed to thinking of genome G+C (guanine plus cytosine) content as a kind of phylogenetic signature. (Related organisms usually have G+C values that are fairly close to one another.) For purposes of the following discussion, I'm going to reference A+T content, which is, of course, just one-minus-GC. (A GC content of 0.25, or 25%, means the AT content is 0.75, or 75%).
What I learned is that mitochondrial DNA shows strand asymmetry in coding regions (regions that actually get transcribed to RNA, as opposed to non-coding "control" regions and junk DNA). In particular, it shows an excess of pyrimidines (T and C) on the "message strand." This is the exact opposite of the situation in Archaea and bacteria, where message strands tend to accumulate purines (G and A).
The interesting thing is, just like bacteria (and Archaea), mitochondrial genomes tend to show a steady, predictable rate of increase of purines on the message strand with increasing A+T, even though purines are outnumbered by pyrimidines on the message strand. A picture might make this clearer:
![]() |
| Purine (A+G) content versus A+T for the message strand of mitochondrial DNA coding regions (N=2543). |
Every point in this graph represents a mitochondrial genome (2,543 in all). As you can see, the regression line (which minimizes the sum of squared error) is upward-sloping, with a rise of 0.149, meaning that for every 10% increase in genome A+T content, there's a corresponding 1.49% increase in message-strand purine (A+G) content. What's striking about this is that in a similar graph for 1,373 bacterial genomes (see this post), the regression-line slope turned out to be 0.148. Chargaff's second parity law predicts a straight horizontal line at y=0.5. Obviously that law is kaput.
I've written before about my repeated finding (in bacteria, Archaea, eukaryotes, viruses, bacteriophage; basically every place I look) that message-strand purine content accumulates in proportion to genome A+T content. Strand asymmetry with respect to purines and pyrimidines seems to be universal. But why?
Strand-asymmetric buildup of purines or pyrimidines is very hard to explain without invoking either a theory of strand-asymmetric DNA repair or a theory of strand-asymmetric mutagenesis, or both. Is it reasonable to suppose that one strand of DNA is more vulnerable to mutagenesis than another? Yes, if you accept that in a growing cell, the strands spend a good portion of their time apart (during transcription and replication). Neither replication nor transcription is symmetric in implementation. I'll spare you the details for the replication side of the argument, but suffice it to say, replication-related asymmetries are not likely (in my opinion) to be behind the purine/pyrminidine strand asymmetries I've been documenting. What we're seeing, I think, is the result of asymmetric repair at transcription time.
During transcription, a gene's DNA strands are separated. One strand is used as a template by RNA polymerase to create messenger RNA and ribosomal RNA. The other strand is free and floppy and vulnerable to attack by mutagens. But it's also readily accessible to repair enzymes.
The above diagram oversimplifies things considerably, but I include it for the benefit of non-biogeeks who might want to follow this argument through. Note that DNA strands have directionality: the sugar bonds face one way in one strand and the other way in the other strand. This is denoted by the so-called 5'-to'3 orientation of strands.(RNAP = RNA polymerase.)
DNA repair is a complex subject. Be assured, every cell, of every kind, has dozens of different kinds of enzymes devoted to DNA repair. Without these enzymes, life as we know it would end, because DNA is constantly undergoing attack and requiring repair.
![]() |
| The Ogg family of DNA base-excision enzymes exhibit a signature helix-hairpin-helix topology (HhH). See Faucher et al., Int J Mol Sci 2012; 13(6): 6711–6729. |
For many years, it was thought that mitochondria did not have DNA repair systems. We now know that's not true. Mitochondrial DNA is subject to constant oxidative attack and it turns out the damage is quickly repaired, in double-stranded DNA. Evidence for repair of single-stranded mtDNA is scant. Those who have looked for a transcription-coupled repair system (or indeed any NER system) in mitochondria have not found one. Mitochondrial BER repair (via Ogg1) does exist, but it seems to operate when the DNA is double-stranded, not during transcription. This makes sense, because for BER to finish, the strand must be nicked by AP endonuclease after the bad base is popped out, then the repair proceeds by matching the opposing base (opposite the abasic site) using the other strand as template. In Clostridia and Archaea (which have an Ogg enzyme that other bacteria do not have; see this post and this paper), Ogg1 can pop out a bad base while the DNA is single-stranded; Ogg1 then binds to the abasic site and is only released by AP endonuclease when it arrives later on.
Bottom line, we know that mitochondrial DNA spends much of its time in the unwound state (because mtDNA products are very highly transcribed) and that the non-transcribed DNA strand is extremely vulnerable to oxidative attack. (The template strand is less vulnerable, because it is cloaked in enzymes: RNA polymerase, transcription factors, ribosomes, etc.) We also know that 8-oxoguanine is the most prevalent form of oxidative damage in mtDNA and that, uncorrected, such damage leads to G-to-T transversion. The finding of consistently high pyrimidine content in the message strand of mitochondrial DNA (see graph further above) is consistent with a slower rate of repair of the non-transcribed strand, and the differential occurrence of G-to-T transversions on that strand. Or at least, that's a possible explanation of the pyrimidine richness of the message strand of mtDNA.
But there are additional factors to consider, such as selection pressure. Mitochondrial DNA tends to encode membrane-associated proteins, and membrane proteins use nonpolar amino acids, which are (in turn) predominantly encoded by pyrimidine-rich codons. More about this in an upcoming post.
Wednesday, July 17, 2013
Highly Expressed Genes: Better-Repaired?
At any given time in any cell, some genes are highly expressed while others are moderately expressed, still others are barely expressed, and quite a few are not expressed at all. The fact that genes vary tremendously in their levels of expression is nothing new, of course, but we still have a lot to learn about how and why some genes have the "Transcribe Me!" knob cranked wide open and others remain dormant until called upon. (For a great paper on this subject, I recommend Samuel Karlin and Jan Mrázek, "Predicted Highly Expressed Genes of Diverse Prokaryotic Genomes," J. Bact. 2000 182:18, 5238-5250, free copy here.)
Reading up on this subject got me to thinking: If DNA undergoes damage and repair at transcription time (when genes are being expressed), shouldn't highly expressed genes differ in mutation rate from rarely expressed genes? (But, in which direction?) Also: Does one strand of highly expressed DNA (the strand that gets transcribed) mutate or repair at a different rate than the other strand?
We know that in most organisms, there is quite an elaborate repair apparatus dedicated to fixing DNA glitches at transcription time. (This is the so-called Transcription Coupled Repair System.) We also know that the TCRS has a preference for the template strand of DNA, just as RNA polymerase does. In fact, it's when RNA polymerase stalls at the site of a thymine dimer (or other major DNA defect) that TCRS kicks into action. Stalled RNAP is the trigger mechanism for TCRS.
But TCRS isn't the only repair option for DNA at transcription time. I've written before about the Archaeal Ogg1 enzyme (which detects and snips out oxidized guanine residues from DNA). The Ogg1 system is a much simpler Base Excision Repair system, fundamentally low-tech compared to the heavy-duty TCRS mechanism. The latter involves nucleotide-excision repair (NER), which means cutting sugars (deoxyribose) out of the DNA backbone and replacement of a whole section of DNA (at great energy cost). BER just snips bases and leaves the underlying sugar(s) in place.
Being a fan of desktop science, I wanted to see if I couldn't devise an experiment of my own to shed light on the question: Does differential repair of DNA strands at transcription time lead to strand asymmetry in highly expressed genes?
Happily, there's a database of highly expressed genes at http://genomes.urv.cat/HEG-DB, which is the perfect starting point for this sort of investigation. For my experiment, I chose the microbe Methanococcus maripaludis strain C5, This tiny organism (isolated from a salt marsh in South Carolina) is a strict anaerobe that lives off hydrogen gas and carbon dioxide. It has a relatively small genome (just under 1.7 million base pairs, enough to code for around 1400 genes). The complete genome is available from here (but don't click unless you want to start a 2-meg download). More to the point, a list of 123 of the creature's most highly expressed genes (HEGs) is available from this page (safe to click; no downloads). The HEGs are putative HEGs inferred from Codon Adaptation Index analysis relative to a reference set of (known-good) high-expression genes. For more details on the HEG ranking process see this excellent paper.
The DNA sequence data for M. maripaludis was easy to match up against the list of HEGs obtained from http://genomes.urv.cat/HEG-DB. In fact, I was able to do all the data-crunching I needed to do with a few lines of JavaScript, in the Chrome console. In no time, I had the adenine (A), guanine (G), and thymine (T) content for all of M. maripaludis's genes, which allowed me to make the following graph:
What we're looking at here is message-strand purine content (A+G) on the y-axis versus A+T content (which is a common phylogenetic metric, akin to G+C content) on the x-axis. As you know if you've been following this blog, I have used purine-vs.-AT plots quite successfully to uncover coding-region strand asymmetries. (See this post and/or this one for details.) The important thing to notice above is that while points tend to fall in a shotgun-blast centered roughly at x=0.66 and y=0.55, the Highly Expressed Genes (HEGs, in red) cover the upper left quadrant of the shotgun blast.
What does it mean? Consider the following. Of the four bases in DNA, guanine (G) is the most vulnerable to oxidative damage. When such damage is left uncorrected, it eventually results in a G-to-T transversion mutation. A large number of such mutations will cause overall A+T to increase (shifting points on the above graph to the right). If G-to-T transversions accumulate preferentially on one strand, the strand in question will see a reduction in purine content (as G, a purine, is replaced by T, a pyrimidine) while the other strand will see a corresponding increase in purine content (via the addition of adenines to pair with the new T's). Bottom line, if G-to-T transversions happen on the message strand, points in the above graph will move to the right and down. If they happen on the template (or transcribed) strand, points will move left and up. What we see in this graph is that HEGs have gone left and up.
The fact that highly expressed genes appear in the upper left quadrant of the distribution means that yes, differential repair is indeed (apparently) happening at transcription time; highly expressed genes are more intensively repaired; and the beneficiary of said repair(s), at least in M. maripaludis, is the message strand (also called the RNA-synonymous or non-transcribed strand) of DNA, which is where our sequence data come from, ultimately. A relative excess of unrepaired 8-oxoguanine on the template strand (or transcribed strand) means guanines are being replaced by thymines on that strand, and new adenines are showing up opposite the thymines, on the message strand, boosting A+G.
I don't know too many other explanations that are consistent with the above graph.
I hasten to add that one graph is just one graph. A single graph isn't enough to prove any kind of universal phenomenon. What we see here applies to Methanococcus maripaludis, an Archaeal anaerobe that may or may not share similarities (vis-a-vis DNA repair) with other organisms.
Reading up on this subject got me to thinking: If DNA undergoes damage and repair at transcription time (when genes are being expressed), shouldn't highly expressed genes differ in mutation rate from rarely expressed genes? (But, in which direction?) Also: Does one strand of highly expressed DNA (the strand that gets transcribed) mutate or repair at a different rate than the other strand?
We know that in most organisms, there is quite an elaborate repair apparatus dedicated to fixing DNA glitches at transcription time. (This is the so-called Transcription Coupled Repair System.) We also know that the TCRS has a preference for the template strand of DNA, just as RNA polymerase does. In fact, it's when RNA polymerase stalls at the site of a thymine dimer (or other major DNA defect) that TCRS kicks into action. Stalled RNAP is the trigger mechanism for TCRS.
But TCRS isn't the only repair option for DNA at transcription time. I've written before about the Archaeal Ogg1 enzyme (which detects and snips out oxidized guanine residues from DNA). The Ogg1 system is a much simpler Base Excision Repair system, fundamentally low-tech compared to the heavy-duty TCRS mechanism. The latter involves nucleotide-excision repair (NER), which means cutting sugars (deoxyribose) out of the DNA backbone and replacement of a whole section of DNA (at great energy cost). BER just snips bases and leaves the underlying sugar(s) in place.
Being a fan of desktop science, I wanted to see if I couldn't devise an experiment of my own to shed light on the question: Does differential repair of DNA strands at transcription time lead to strand asymmetry in highly expressed genes?
![]() |
| Methanococcus maripaludis |
The DNA sequence data for M. maripaludis was easy to match up against the list of HEGs obtained from http://genomes.urv.cat/HEG-DB. In fact, I was able to do all the data-crunching I needed to do with a few lines of JavaScript, in the Chrome console. In no time, I had the adenine (A), guanine (G), and thymine (T) content for all of M. maripaludis's genes, which allowed me to make the following graph:
What we're looking at here is message-strand purine content (A+G) on the y-axis versus A+T content (which is a common phylogenetic metric, akin to G+C content) on the x-axis. As you know if you've been following this blog, I have used purine-vs.-AT plots quite successfully to uncover coding-region strand asymmetries. (See this post and/or this one for details.) The important thing to notice above is that while points tend to fall in a shotgun-blast centered roughly at x=0.66 and y=0.55, the Highly Expressed Genes (HEGs, in red) cover the upper left quadrant of the shotgun blast.
What does it mean? Consider the following. Of the four bases in DNA, guanine (G) is the most vulnerable to oxidative damage. When such damage is left uncorrected, it eventually results in a G-to-T transversion mutation. A large number of such mutations will cause overall A+T to increase (shifting points on the above graph to the right). If G-to-T transversions accumulate preferentially on one strand, the strand in question will see a reduction in purine content (as G, a purine, is replaced by T, a pyrimidine) while the other strand will see a corresponding increase in purine content (via the addition of adenines to pair with the new T's). Bottom line, if G-to-T transversions happen on the message strand, points in the above graph will move to the right and down. If they happen on the template (or transcribed) strand, points will move left and up. What we see in this graph is that HEGs have gone left and up.
The fact that highly expressed genes appear in the upper left quadrant of the distribution means that yes, differential repair is indeed (apparently) happening at transcription time; highly expressed genes are more intensively repaired; and the beneficiary of said repair(s), at least in M. maripaludis, is the message strand (also called the RNA-synonymous or non-transcribed strand) of DNA, which is where our sequence data come from, ultimately. A relative excess of unrepaired 8-oxoguanine on the template strand (or transcribed strand) means guanines are being replaced by thymines on that strand, and new adenines are showing up opposite the thymines, on the message strand, boosting A+G.
I don't know too many other explanations that are consistent with the above graph.
I hasten to add that one graph is just one graph. A single graph isn't enough to prove any kind of universal phenomenon. What we see here applies to Methanococcus maripaludis, an Archaeal anaerobe that may or may not share similarities (vis-a-vis DNA repair) with other organisms.
Sunday, July 14, 2013
DNA Strand Asymmetry: More Surprises
The surprises just keep coming. When you start doing comparative genomics on the desktop (which is so easy with all the great tools at genomevolution.org and elsewhere), it's amazing how quickly you run into things that make you slap yourself on the side of the head and go "Whaaaa????"
If you know anything about DNA (or even if you don't), this one will set you back.
I've written before about Chargaff's second parity rule, which (peculiarly) states that A = T and G = C not just for double-stranded DNA (that's the first parity rule) but for bases in a single strand of DNA. The first parity rule is basic: It's what allows one strand of DNA to be complementary to another. The second parity rule is not so intuitive. Why should the amount of adenine have to equal the amount of thymine (or guanine equal cytosine) in a single strand of DNA? The conventional argument is that nature doesn't play favorites with purines and pyrimidines. There's no reason (in theory) why a single strand of DNA should have an excess of purines over pyrimidines or vice versa, all things being equal.
But it turns out, strand asymmetry vis-a-vis purines and pyrimidines is not only not uncommon, it's the rule. (Some call it Szybalski's rule, in fact.) You can prove it to yourself very easily. If you obtain a codon usage chart for a particular organism, then add the frequencies of occurrence of each base in each codon, you can get the relative abundances of the four bases (A, G, T, C) for the coding regions on which the codon chart was based. Let's take a simple example that requires no calculation: Clostridium botulinum. Just by eyeballing the chart below, you can quickly see that (for C. botulinum) codons using purines A and G are way-more-often used than codons containing pyrimidines T and C. (Note the green-highlighted codons.)
If you do the math, you'll find that in C. botulinum, G and A (combined) outnumber T and C by a factor of 1.41. That's a pretty extreme purine:pyrimidine ratio. (Remember that we're dealing with a single strand of DNA here. Codon frequencies are derived from the so-called "message strand" of DNA in coding regions.)
I've done this calculation for 1,373 different bacterial species (don't worry, it's all automated), and the bottom line is, the greater the DNA's A+T content (or, equivalently, the less its G+C content), the greater the purine imbalance. (See this post for a nice graph.)
If you inspect enough codon charts you'll quickly realize that Chargaff's second parity rule never holds true (except now and then by chance). It's a bogus rule, at least in coding regions (DNA that actually gets transcribed in vivo). It may have applicability to pseudogenes or "junk DNA" (but then again, I haven't checked; it may well not apply there either).
If Chargaff's second rule were true, we would expect to find that G = C (and A = T), because that's what the rule says. I went through the codon frequency data for 1,373 different bacterial species and then plotted the ratio of G to C (which Chargaff says should equal 1.0) for each species against the A+T content (which is a kind of phylogenetic signature) for each species. I was shocked by what I found:
I wasn't so much shocked by the fact that Chargaff's rule doesn't hold; I already knew that. What's shocking is that the ratio of G to C goes up as A+T increases, which means G/C is going up even as G+C is going down. (By definition, G+C goes down as A+T goes up.)
Chargaff says G/C should always equal 1.0. In reality, it never does except by chance. What we find is, the less G (or C) the DNA has, the greater the ratio of G to C. To put it differently: At the high-AT end of the phylogenetic scale, cytosine is decreasing faster (much faster) than guanine, as overall G+C content goes down.
When I first plotted this graph, I used a linear regression to get a line that minimizes the sum of squared absolute error. That line turned out to be given by 0.638 + [A+T]. Then I saw that the data looked exponential, not linear. So I refitted the data with a power curve (the red curve shown above) given by
which fit the data even better (minimum summed error 0.1119 instead of 0.1197). What struck me as strange is that the Golden Ratio (1.618) shows up in the power-curve formula (above), but also, the linear form of the regression has G/C equaliing 1.638 when [A+T] goes to 1.0. Which is almost the Golden Ratio.
In a previous post, I mentioned finding that the ratio A/T tends to approximate the Golden Ratio as A+T approaches 1.0. If this were to hold true, it could mean that A/T and G/C both approach the Golden Ratio as A+T approaches 1.0, which would be weird indeed.
For now, I'm not going to make the claim that the Golden Ratio figures into any of this, because it reeks too much of numerology and Intelligent Design (and I'm a fan of neither). I do think it's mildly interesting that A/T and G/C both approach a similar number as A+T approaches unity.
Comments, as usual, are welcome.
If you know anything about DNA (or even if you don't), this one will set you back.
I've written before about Chargaff's second parity rule, which (peculiarly) states that A = T and G = C not just for double-stranded DNA (that's the first parity rule) but for bases in a single strand of DNA. The first parity rule is basic: It's what allows one strand of DNA to be complementary to another. The second parity rule is not so intuitive. Why should the amount of adenine have to equal the amount of thymine (or guanine equal cytosine) in a single strand of DNA? The conventional argument is that nature doesn't play favorites with purines and pyrimidines. There's no reason (in theory) why a single strand of DNA should have an excess of purines over pyrimidines or vice versa, all things being equal.
But it turns out, strand asymmetry vis-a-vis purines and pyrimidines is not only not uncommon, it's the rule. (Some call it Szybalski's rule, in fact.) You can prove it to yourself very easily. If you obtain a codon usage chart for a particular organism, then add the frequencies of occurrence of each base in each codon, you can get the relative abundances of the four bases (A, G, T, C) for the coding regions on which the codon chart was based. Let's take a simple example that requires no calculation: Clostridium botulinum. Just by eyeballing the chart below, you can quickly see that (for C. botulinum) codons using purines A and G are way-more-often used than codons containing pyrimidines T and C. (Note the green-highlighted codons.)
If you do the math, you'll find that in C. botulinum, G and A (combined) outnumber T and C by a factor of 1.41. That's a pretty extreme purine:pyrimidine ratio. (Remember that we're dealing with a single strand of DNA here. Codon frequencies are derived from the so-called "message strand" of DNA in coding regions.)
I've done this calculation for 1,373 different bacterial species (don't worry, it's all automated), and the bottom line is, the greater the DNA's A+T content (or, equivalently, the less its G+C content), the greater the purine imbalance. (See this post for a nice graph.)
If you inspect enough codon charts you'll quickly realize that Chargaff's second parity rule never holds true (except now and then by chance). It's a bogus rule, at least in coding regions (DNA that actually gets transcribed in vivo). It may have applicability to pseudogenes or "junk DNA" (but then again, I haven't checked; it may well not apply there either).
If Chargaff's second rule were true, we would expect to find that G = C (and A = T), because that's what the rule says. I went through the codon frequency data for 1,373 different bacterial species and then plotted the ratio of G to C (which Chargaff says should equal 1.0) for each species against the A+T content (which is a kind of phylogenetic signature) for each species. I was shocked by what I found:
I wasn't so much shocked by the fact that Chargaff's rule doesn't hold; I already knew that. What's shocking is that the ratio of G to C goes up as A+T increases, which means G/C is going up even as G+C is going down. (By definition, G+C goes down as A+T goes up.)
Chargaff says G/C should always equal 1.0. In reality, it never does except by chance. What we find is, the less G (or C) the DNA has, the greater the ratio of G to C. To put it differently: At the high-AT end of the phylogenetic scale, cytosine is decreasing faster (much faster) than guanine, as overall G+C content goes down.
When I first plotted this graph, I used a linear regression to get a line that minimizes the sum of squared absolute error. That line turned out to be given by 0.638 + [A+T]. Then I saw that the data looked exponential, not linear. So I refitted the data with a power curve (the red curve shown above) given by
G/C = 1.0 + 0.587*[A+T] + 1.618*[A+T]2
which fit the data even better (minimum summed error 0.1119 instead of 0.1197). What struck me as strange is that the Golden Ratio (1.618) shows up in the power-curve formula (above), but also, the linear form of the regression has G/C equaliing 1.638 when [A+T] goes to 1.0. Which is almost the Golden Ratio.
In a previous post, I mentioned finding that the ratio A/T tends to approximate the Golden Ratio as A+T approaches 1.0. If this were to hold true, it could mean that A/T and G/C both approach the Golden Ratio as A+T approaches 1.0, which would be weird indeed.
For now, I'm not going to make the claim that the Golden Ratio figures into any of this, because it reeks too much of numerology and Intelligent Design (and I'm a fan of neither). I do think it's mildly interesting that A/T and G/C both approach a similar number as A+T approaches unity.
Comments, as usual, are welcome.
Wednesday, July 10, 2013
Shedding Light on DNA Strand Asymmetry
In 1950, Erwin Chargaff was the first to report that the amount of adenine (A) in DNA equals the amount of thymine (T), and the amount of guanine (G) equals the amount of cytosine (C). This result was instrumental in helping Watson and Crick (and Rosalind Franklin) determine the structure of DNA.
It's pretty easy to understand that every A on one strand of DNA pairs with a T on the other strand (and every G pairs with an opposite-strand C); this explains DNA complementarity and the associated replication model. But somewhere along the line, Chargaff was credited with the much less obvious rule that A = T and G = C even for individual strands of DNA that aren't paired with anything. This is the so-called second parity rule attributed to Chargaff, although I can't find any record of Chargaff himself having postulated such a rule. The Chargaff papers that are so often cited as supporting this rule (in particular the 3-paper series culminating in this report in PNAS) do not, in fact, offer such a rule, and if you read the papers carefully, what Chargaff and colleagues actually found was that one strand of DNA is heavier than the other (they label the strands 'H' and 'L', for Heavy and Light); not only that, but Chargaff et al. reported a consistent difference in purine content between strands (see Table 1 of this paper).
When I interviewed Linus Pauling in 1977, he cautioned me to always read the Results section of a paper carefully, because people will often conclude something entirely different than what the Results actually showed, or cite a paper as showing "ABC" when the data actually showed "XYZ."
How right he was.
At any rate, it turns out that the "message" strand of a gene hardly ever contains equal amounts of purines and pyrimidines. Codon analysis reveals that as genes become richer in A+T content (or as G+C content goes down), the excess of purines on the message strand becomes larger and larger. This is depicted in the following graph, which shows message-strand purine content (A+G) plotted against A+T content, for 1,373 distinct bacterial species. (No species is represented twice.)
It's quite obvious that when A+T content is above approximately 33%, as it is for most bacterial species, the message strand tends to be comparatively purine-rich. Below A+T = 33%, the message strand becomes more pyrimidine-rich than purine-rich. (Note: In bacteria, where most of the DNA is in coding regions, codon-derived A+T content is very close to whole-genome A+T content. I checked the 1,373 species graphed here and found whole-chromosome A+T to differ from codon-derived A+T by an average of less than 7 parts in 10,000.)
The correlation between A+T and purine content is strong (r=0.85). Still, you can see that quite a few points have drifted far from the regression line, especially in the region of x = 0.5 to x = 0.7, where lots of points lie above y = 0.55. What's going on with those organisms? I decided to do some investigating.
First, some basics. Over time, transition mutations (AT↔GC) can change an organism's A+T content and thus move it along the x-axis of the graph, but transitions cannot move an organism higher or lower on the graph, because (by definition) transitions don't affect the strandwise purine balance.
Transversions, on the other hand, can affect strandwise purine balance (in theory, at least), but only if they occur more often on one strand of DNA than the other. (I should say: occur more often, or are fixed more often, on one strand versus the other.) For example, let's say G-to-T transversions are the most common kind of transversion (which is probably true, given that guanine is the most easily oxidized of the four bases and given the fact that failure to repair 8-oxoguanine lesions does lead to eventual replacement with thymine). And let's say G-to-T transversions are most likely to occur on the non-transcribed strand of DNA, at transcription time. (The non-transcribed strand is uncoiled and unprotected while transcription is taking place on the other strand.) Over time, the non-transcribed strand would lose guanines; they'd be replaced by thymines. The message strand, or RNA-synonymous strand (which is also the non-transcribed strand) would become pyrimidine-rich and the other strand would become purine-rich.
Unfortunately, while that's exactly what happens for organisms with A+T content below 33%, precisely the opposite happens (purines accumulate on the message strand) in organisms with A+T above 33%. And in fact, in some high-AT organisms, the purine content of message strands is rather extreme. How can we explain that?
One possibility is that some organisms have evolved extremely effective transversion repair systems for the message (non-transcribed) strand of genes—systems that are so effective, no G-to-T transversions go unrepaired on the message strand. The transcribed strand, on the other hand, doesn't get the benefit of this repair system, possibly because the repair enzymes can't access the strand: it's engulfed in transcription factors, topoisomerases, RNA polymerase, nearby ribosomal machinery, etc.
If the non-transcribed strand never mutates (because all mutations are swiftly repaired), then the transcribed strand will (in the absence of equally effective repairs) eventually accumulate G-to-T mutations, and the message strand will accumulate adenines (purines). Perhaps.
In the graph further above, you'll notice at x = 0.6 a tiny spur of points hangs down at around y = 0.5. These points belong to some Bartonella species, plus a Parachlamydia and another chlamydial organism. These are endosymbionts that have lost a good portion of their genomes over time. It seems likely they've lost some transversion-repair machinery. During transcription, their message strands are going unrepaired. G-to-T transversions happen on the message strand, rendering it light in purines. Such a scenario seems plausible, at least.
By this reasoning, maybe points far above the regression line represent organisms that have gained repair functionality, such that their message strands never undergo G-to-T transversions (although their transcribed strands do). Is this possible?
Examination of the highest points on the graph shows a predominance of Clostridia. (Not just members of the genus Clostridium, but the class Clostridia, which is a large, ancient, and diverse class of anaerobes.) One thing we know about the Clostridia is that unlike all other bacteria (unlike members of the Gammaproteobacteria, the Alpha- and Betaproteobacteria, the Actinomycetes, the Bacteroidetes, etc.), the Clostridia have Ogg1, otherwise known as 8-oxoguanine glycosylase (which specifically prevents G-to-T transversions). They share this capability with all members of the Archaea, and all higher life forms as well.
Note that while non-Ogg1 enzymes exist for correcting 8-oxoguanine lesions (e.g., MutM, MutY, mfd), there is evidence that Ogg1 is specifically involved in repair of 8oxoG lesions in non-transcribed strands of DNA, at transcription time. (The other 8oxoG repair systems may not be strand-specific.)
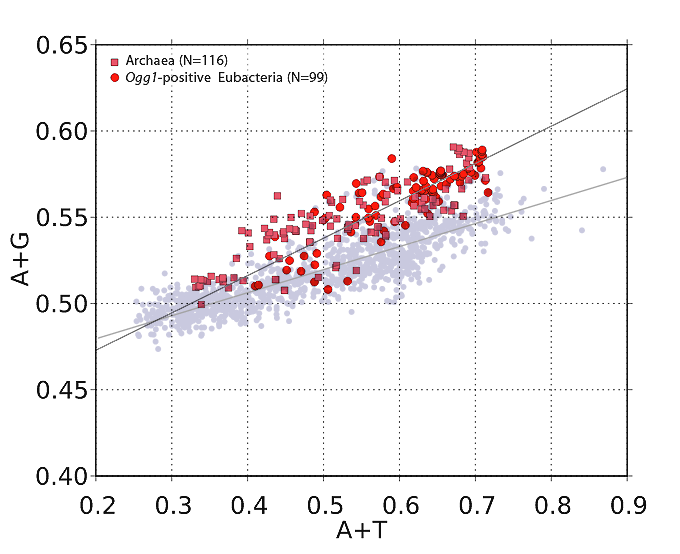
If Archaea benefit from Ogg1 the way Clostridia do, they too should fall well above the regression line on a graph of A+G versus A+T. And this is exactly what we find. In the graph below, the pink squares are members of Archaea that came up positive in a protein-Blast query against Drosophila Ogg1. (I'll explain why I used Drosophila in a minute.) The red-orange circles are bacterial species (mostly from class Clostridia) that turned up Ogg1-positive in a similar Blast search.
The points in this plot are significantly higher on the y-axis than points in the all-bacteria plot (and the regression line is steeper), consistent with a different DNA repair profile.
In identifying Ogg1-positive organisms, I wanted to avoid false positives (organisms with enzymes that share characteristics of Ogg1 but that aren't truly Ogg1), so for the Blast query I used Drosophila's Ogg1 as a reference enzyme, since it is well studied (unlike Archaeal or Clostridial Ogg1). I also set the E-value cutoff at 1e-10, to reduce spurious matches with DNA repair enzymes or nucleases that might have domain similarity with Ogg1 but aren't Ogg1. In addition, I did spot checks to be sure the putative Ogg1 matches that came up were not actually matches of Fpg (MutM), RecA, RadA, MutY, DNA-3-methyladenine glycosidase, or other DNA-binding enzymes.
Bottom line, organisms that have an Archaeal 8-oxoguanine glycosylase enzyme (mostly obligate anaerobes) occupy a unique part of the A+G vs. A+T graph. Which makes sense. It's only logical that anaerobes would have different DNA repair strategies (and a different "repairosome") than oxygen-tolerant bacteria, because oxidative stress is, in general, handled much differently in anaerobes. The fact that they bring different repair tactics to bear on DNA shouldn't come as a surprise.
It's pretty easy to understand that every A on one strand of DNA pairs with a T on the other strand (and every G pairs with an opposite-strand C); this explains DNA complementarity and the associated replication model. But somewhere along the line, Chargaff was credited with the much less obvious rule that A = T and G = C even for individual strands of DNA that aren't paired with anything. This is the so-called second parity rule attributed to Chargaff, although I can't find any record of Chargaff himself having postulated such a rule. The Chargaff papers that are so often cited as supporting this rule (in particular the 3-paper series culminating in this report in PNAS) do not, in fact, offer such a rule, and if you read the papers carefully, what Chargaff and colleagues actually found was that one strand of DNA is heavier than the other (they label the strands 'H' and 'L', for Heavy and Light); not only that, but Chargaff et al. reported a consistent difference in purine content between strands (see Table 1 of this paper).
When I interviewed Linus Pauling in 1977, he cautioned me to always read the Results section of a paper carefully, because people will often conclude something entirely different than what the Results actually showed, or cite a paper as showing "ABC" when the data actually showed "XYZ."
How right he was.
At any rate, it turns out that the "message" strand of a gene hardly ever contains equal amounts of purines and pyrimidines. Codon analysis reveals that as genes become richer in A+T content (or as G+C content goes down), the excess of purines on the message strand becomes larger and larger. This is depicted in the following graph, which shows message-strand purine content (A+G) plotted against A+T content, for 1,373 distinct bacterial species. (No species is represented twice.)
![]() |
| Codon analysis reveals that as A+T content increases, message-strand purine content (A+G) increases. Each point on this graph represents a unique bacterial species (N=1373). |
It's quite obvious that when A+T content is above approximately 33%, as it is for most bacterial species, the message strand tends to be comparatively purine-rich. Below A+T = 33%, the message strand becomes more pyrimidine-rich than purine-rich. (Note: In bacteria, where most of the DNA is in coding regions, codon-derived A+T content is very close to whole-genome A+T content. I checked the 1,373 species graphed here and found whole-chromosome A+T to differ from codon-derived A+T by an average of less than 7 parts in 10,000.)
The correlation between A+T and purine content is strong (r=0.85). Still, you can see that quite a few points have drifted far from the regression line, especially in the region of x = 0.5 to x = 0.7, where lots of points lie above y = 0.55. What's going on with those organisms? I decided to do some investigating.
First, some basics. Over time, transition mutations (AT↔GC) can change an organism's A+T content and thus move it along the x-axis of the graph, but transitions cannot move an organism higher or lower on the graph, because (by definition) transitions don't affect the strandwise purine balance.
Transversions, on the other hand, can affect strandwise purine balance (in theory, at least), but only if they occur more often on one strand of DNA than the other. (I should say: occur more often, or are fixed more often, on one strand versus the other.) For example, let's say G-to-T transversions are the most common kind of transversion (which is probably true, given that guanine is the most easily oxidized of the four bases and given the fact that failure to repair 8-oxoguanine lesions does lead to eventual replacement with thymine). And let's say G-to-T transversions are most likely to occur on the non-transcribed strand of DNA, at transcription time. (The non-transcribed strand is uncoiled and unprotected while transcription is taking place on the other strand.) Over time, the non-transcribed strand would lose guanines; they'd be replaced by thymines. The message strand, or RNA-synonymous strand (which is also the non-transcribed strand) would become pyrimidine-rich and the other strand would become purine-rich.
Unfortunately, while that's exactly what happens for organisms with A+T content below 33%, precisely the opposite happens (purines accumulate on the message strand) in organisms with A+T above 33%. And in fact, in some high-AT organisms, the purine content of message strands is rather extreme. How can we explain that?
One possibility is that some organisms have evolved extremely effective transversion repair systems for the message (non-transcribed) strand of genes—systems that are so effective, no G-to-T transversions go unrepaired on the message strand. The transcribed strand, on the other hand, doesn't get the benefit of this repair system, possibly because the repair enzymes can't access the strand: it's engulfed in transcription factors, topoisomerases, RNA polymerase, nearby ribosomal machinery, etc.
If the non-transcribed strand never mutates (because all mutations are swiftly repaired), then the transcribed strand will (in the absence of equally effective repairs) eventually accumulate G-to-T mutations, and the message strand will accumulate adenines (purines). Perhaps.
In the graph further above, you'll notice at x = 0.6 a tiny spur of points hangs down at around y = 0.5. These points belong to some Bartonella species, plus a Parachlamydia and another chlamydial organism. These are endosymbionts that have lost a good portion of their genomes over time. It seems likely they've lost some transversion-repair machinery. During transcription, their message strands are going unrepaired. G-to-T transversions happen on the message strand, rendering it light in purines. Such a scenario seems plausible, at least.
By this reasoning, maybe points far above the regression line represent organisms that have gained repair functionality, such that their message strands never undergo G-to-T transversions (although their transcribed strands do). Is this possible?
Examination of the highest points on the graph shows a predominance of Clostridia. (Not just members of the genus Clostridium, but the class Clostridia, which is a large, ancient, and diverse class of anaerobes.) One thing we know about the Clostridia is that unlike all other bacteria (unlike members of the Gammaproteobacteria, the Alpha- and Betaproteobacteria, the Actinomycetes, the Bacteroidetes, etc.), the Clostridia have Ogg1, otherwise known as 8-oxoguanine glycosylase (which specifically prevents G-to-T transversions). They share this capability with all members of the Archaea, and all higher life forms as well.
Note that while non-Ogg1 enzymes exist for correcting 8-oxoguanine lesions (e.g., MutM, MutY, mfd), there is evidence that Ogg1 is specifically involved in repair of 8oxoG lesions in non-transcribed strands of DNA, at transcription time. (The other 8oxoG repair systems may not be strand-specific.)
If Archaea benefit from Ogg1 the way Clostridia do, they too should fall well above the regression line on a graph of A+G versus A+T. And this is exactly what we find. In the graph below, the pink squares are members of Archaea that came up positive in a protein-Blast query against Drosophila Ogg1. (I'll explain why I used Drosophila in a minute.) The red-orange circles are bacterial species (mostly from class Clostridia) that turned up Ogg1-positive in a similar Blast search.
The points in this plot are significantly higher on the y-axis than points in the all-bacteria plot (and the regression line is steeper), consistent with a different DNA repair profile.
In identifying Ogg1-positive organisms, I wanted to avoid false positives (organisms with enzymes that share characteristics of Ogg1 but that aren't truly Ogg1), so for the Blast query I used Drosophila's Ogg1 as a reference enzyme, since it is well studied (unlike Archaeal or Clostridial Ogg1). I also set the E-value cutoff at 1e-10, to reduce spurious matches with DNA repair enzymes or nucleases that might have domain similarity with Ogg1 but aren't Ogg1. In addition, I did spot checks to be sure the putative Ogg1 matches that came up were not actually matches of Fpg (MutM), RecA, RadA, MutY, DNA-3-methyladenine glycosidase, or other DNA-binding enzymes.
Bottom line, organisms that have an Archaeal 8-oxoguanine glycosylase enzyme (mostly obligate anaerobes) occupy a unique part of the A+G vs. A+T graph. Which makes sense. It's only logical that anaerobes would have different DNA repair strategies (and a different "repairosome") than oxygen-tolerant bacteria, because oxidative stress is, in general, handled much differently in anaerobes. The fact that they bring different repair tactics to bear on DNA shouldn't come as a surprise.
Friday, June 21, 2013
RNA Folding and Purine Loading
The other day I learned that an acquaintance of mine had done graduate work in a famous molecular genetics lab. We started "talking shop," and I happened to mention some of my recent bioinformatics forays, in particular my recent unexpected finding that the purine content of mRNA can be predicted from the G+C (guanine plus cytosine) content of the genome.
My friend asked what the implications of this might be. I offered a couple of thoughts. First, I said that just as differences in G+C content between genes in a given organism can sometimes be used to detect foreign genes (e.g., embedded phage/virus genes, horizontal gene transfers, etc.), variations in the purine to pyrimidine ratio of gene coding strands might also be a way to detect foreign genes. For example, in an organism like Clostridium botulinum, where the genome's coding regions have an average purine content of 58.5%, finding a gene with purine content below 46% (two standard deviations away from the mean) might be a tipoff that the gene came from a different organism. This is a useful new technique, because genes with high-purine-content coding regions don't always have high A+T content (thus, detection of horizontal gene transfers via purine loading will expose genes that would otherwise be missed on the basis of G+C content). In other words, two genes might have exactly the same G+C (or A+T) characteristics but differ in purine content. The difference in purine content would be the tipoff to a possible horizontal-gene-transfer event.
Another implication of the A+G versus A+T relationship involves foreign RNA detection. Bacteria need to be able to detect self versus non-self nucleic acids. (Incoming phage nucleic acids need to be detected and destroyed; and in fact, they are. This is how restriction enzymes were discovered.) Messenger RNA has secondary structure: it undergoes folding, based on intrastrand regions of complementarity. The amount of complementarity depends on the relative abundances of purine and pyrimidines that can pair with one another. If a strand of RNA is mostly purines (or mostly pyrimidines, for that matter), there will be less opportunity to self-anneal than if purines and pyrimidines are equally abundant. Thus, the folding of RNA will be different in an organism with high genome A+T content (low G+C content) than in an organism with low A+T.
An example of how purine loading can affect folding is shown below. The graphic shows the minimum-free-energy folding of the mRNA for catalase in Staphylococcus epidermidis strain RP62A (left) and Pseudomonas putida strain GB-1 (on the right). The Staph version of this messenger RNA has a 1.28 ratio of purines to pyrimidines, whereas the Pseudomonas version has a 0.98 purine-pyrimidine ratio. As a result, the potential for purine-pyrimidine hydrogen bonding is considerably less in the Staph version of the mRNA than in the Pseudomonas version, and you can easily see this by comparing the two RNAs shown below. The one on the left has far more loops (areas where bases are not complementary) and complex branching structures. In the mRNA on the right, long sections of the molecule are able to line up to form double-stranded structures; loops are few in number, and small.
This kind of difference can explain the ability of various strains of bacteria to reject infectious RNA from another strain's viruses (phage). Foreign RNA entering a cell will "look" foreign to the cell's endogenous complement of RNA nucleases, and based on this, host nucleases will quickly destroy the intruder RNA. This mechanism provides a primitive kind of immune system for bacteria.
There is one other important implication of the purine-loading curve. The curve resolves one long-standing open question in molecular biology, having to do with mutation rates. I'll talk about it in tomorrow's post. Please join me then—and bring a biologist-friend!
My friend asked what the implications of this might be. I offered a couple of thoughts. First, I said that just as differences in G+C content between genes in a given organism can sometimes be used to detect foreign genes (e.g., embedded phage/virus genes, horizontal gene transfers, etc.), variations in the purine to pyrimidine ratio of gene coding strands might also be a way to detect foreign genes. For example, in an organism like Clostridium botulinum, where the genome's coding regions have an average purine content of 58.5%, finding a gene with purine content below 46% (two standard deviations away from the mean) might be a tipoff that the gene came from a different organism. This is a useful new technique, because genes with high-purine-content coding regions don't always have high A+T content (thus, detection of horizontal gene transfers via purine loading will expose genes that would otherwise be missed on the basis of G+C content). In other words, two genes might have exactly the same G+C (or A+T) characteristics but differ in purine content. The difference in purine content would be the tipoff to a possible horizontal-gene-transfer event.
Another implication of the A+G versus A+T relationship involves foreign RNA detection. Bacteria need to be able to detect self versus non-self nucleic acids. (Incoming phage nucleic acids need to be detected and destroyed; and in fact, they are. This is how restriction enzymes were discovered.) Messenger RNA has secondary structure: it undergoes folding, based on intrastrand regions of complementarity. The amount of complementarity depends on the relative abundances of purine and pyrimidines that can pair with one another. If a strand of RNA is mostly purines (or mostly pyrimidines, for that matter), there will be less opportunity to self-anneal than if purines and pyrimidines are equally abundant. Thus, the folding of RNA will be different in an organism with high genome A+T content (low G+C content) than in an organism with low A+T.
An example of how purine loading can affect folding is shown below. The graphic shows the minimum-free-energy folding of the mRNA for catalase in Staphylococcus epidermidis strain RP62A (left) and Pseudomonas putida strain GB-1 (on the right). The Staph version of this messenger RNA has a 1.28 ratio of purines to pyrimidines, whereas the Pseudomonas version has a 0.98 purine-pyrimidine ratio. As a result, the potential for purine-pyrimidine hydrogen bonding is considerably less in the Staph version of the mRNA than in the Pseudomonas version, and you can easily see this by comparing the two RNAs shown below. The one on the left has far more loops (areas where bases are not complementary) and complex branching structures. In the mRNA on the right, long sections of the molecule are able to line up to form double-stranded structures; loops are few in number, and small.
![]() |
| The minimum-free-energy folding for two catalase mRNAs, one with high purine content (Staphylococcus, left) and one with lower purine content (Pseudomonas, right). Foldings were generated by http://rna.tbi.univie.ac.at/cgi-bin/RNAfold.cgi. Click to enlarge image. |
This kind of difference can explain the ability of various strains of bacteria to reject infectious RNA from another strain's viruses (phage). Foreign RNA entering a cell will "look" foreign to the cell's endogenous complement of RNA nucleases, and based on this, host nucleases will quickly destroy the intruder RNA. This mechanism provides a primitive kind of immune system for bacteria.
There is one other important implication of the purine-loading curve. The curve resolves one long-standing open question in molecular biology, having to do with mutation rates. I'll talk about it in tomorrow's post. Please join me then—and bring a biologist-friend!
Saturday, June 01, 2013
A New Biological Constant?
Earlier, I gave evidence for a surprising relationship between the amount of G+C (guanine plus cytosine) in DNA and the amount of "purine loading" on the message strand in coding regions. The fact that message strands are often purine-rich is not new, of course; it's called Szybalski's Rule. What's new and unexpected is that the amount of G+C in the genome lets you predict the amount of purine loading. Also, Szybalski's rule is not always right.
Since the last time I wrote on this subject, I've had the chance to look at more than 1,000 additional genomes. What I've found is that the relationship between purine loading and G+C content applies not only to bacteria (and archaea) and eukaryotes, but to mitochondrial DNA, chloroplast DNA, and virus genomes (plant, animal, phage), as well.
The accompanying graphs tell the story, but I should explain a change in the way these graphs are prepared versus the graphs in my earlier posts. Earlier, I plotted G+C along the X-axis and purine/pyrmidine ratio on the Y-axis. I now plot A+T on the X-axis instead of G+C, in order to convert an inverse relationship to a direct relationship. Also, I now plot A+G (purines, as a mole fraction) on the Y-axis. Thus, X- and Y-axes are now both expressed in mole fractions, hence both are normalized to the unit interval (i.e., all values range from 0..1).
The graph above shows the relationship between genome A+T content and purine content of message strands in genomes for 260 bacterial genera. The straight line is regression-fitted to minimize the sum of squared absolute error. (Software by http://zunzun.com.) The line conforms to:
The line predicts that if a genome were to consist entirely of G+C (guanine and cytosine), it would be 45.54% guanine, whereas if (in some mythical creature) the genome were to consist entirely of A+T (adenine and thymine), adenine would comprise 59.99% of the DNA. Interestingly, the 95% confidence interval permits a value of 0.61803 at X = 1.0, which would mean that as guanine and cytosine diminish to zero, A/T approaches the Golden Ratio.
Do the most primitive bacteria (Archaea) also obey this relationship? Yes, they do. In preparing the graph below, I analyzed codon usage in 122 Archaeal genera to obtain A, G, T, and C relative proportions in coding regions of genes. As you can see, the same basic relationship exists between purine content and A+T in Archaea as in Eubacteria. Regression analysis yielded a line with a slope of 0.16911 and a vertical offset 0.45865. So again, it's possible (or maybe it's just a very strange coincidence) that A/T approaches the Golden Ratio as A+T approaches unity.
For the graph below, I analyzed 114 eukaryotic genomes (everything from fungi and protists to insects, fish, worms, flowering and non-flowering plants, mosses, algae, and sundry warm- and cold-blooded animals). The slope of the generated regression line is 0.11567 and the vertical offset is 0.46116.
Mitochondria and chloroplasts (see the two graphs below) show a good bit more scatter in the data, but regression analysis still comes back with positive slopes (0.06702 and .13188, respectively) for the line of least squared absolute error.
To see if this same fundamental relationship might hold even for viral genetic material, I looked at codon usage in 229 varieties of bacteriophage and 536 plant and animal viruses ranging in size from 3Kb to over 200 kilobases. Interestingly enough, the relationship between A+T and message-strand purine loading does indeed apply to viruses, despite the absence of dedicated protein-making machinery in a virion.
For the 536 plant and animal viruses (above left), the regression line has a slope of 0.23707 and meets the Y-axis at 0.62337 when X = 1.0. For bacteriophage (above right), the line's slope is 0.13733 and the vertical offset is 0.46395. (When inspecting the graphs, take note that the vertical-axis scaling is not the same for each graph. Hence the slopes are deceptive.) The Y-intercept at X = 1.0 is 0.60128. So again, it's possible A/T approaches the golden ratio as A+T approaches 100%.
The fact that viral nucleic acids follow the same purine trajectories as their hosts perhaps shouldn't come as a surprise, because viral genetic material is (in general) highly adapted to host machinery. Purine loading appropriate to the A+T milieu is just another adaptation.
It's striking that so many genomes, from so many diverse organisms (eubacteria, archaea, eukaryotes, viruses, bacteriophages, plus organelles), follow the same basic law of approximately
The above law is as universal a law of biology as I've ever seen. The only question is what to call the slope term. It's clearly a biological constant of considerable significance. Its physical interpretation is clear: It's the rate at which purines are accumulated in mRNA as genome A+T content increases. It says that a 1% increase in A+T content (or a 1% decrease in genome G+C content) is worth a 0.14% increase in purine content in message strands. Maybe it should be called the purine rise rate? The purine amelioration rate?
Biologists, please feel free to get in touch to discuss. I'm interested in hearing your ideas. Reach out to me on LinkedIn, or simply leave a comment below.
Since the last time I wrote on this subject, I've had the chance to look at more than 1,000 additional genomes. What I've found is that the relationship between purine loading and G+C content applies not only to bacteria (and archaea) and eukaryotes, but to mitochondrial DNA, chloroplast DNA, and virus genomes (plant, animal, phage), as well.
The accompanying graphs tell the story, but I should explain a change in the way these graphs are prepared versus the graphs in my earlier posts. Earlier, I plotted G+C along the X-axis and purine/pyrmidine ratio on the Y-axis. I now plot A+T on the X-axis instead of G+C, in order to convert an inverse relationship to a direct relationship. Also, I now plot A+G (purines, as a mole fraction) on the Y-axis. Thus, X- and Y-axes are now both expressed in mole fractions, hence both are normalized to the unit interval (i.e., all values range from 0..1).
The graph above shows the relationship between genome A+T content and purine content of message strands in genomes for 260 bacterial genera. The straight line is regression-fitted to minimize the sum of squared absolute error. (Software by http://zunzun.com.) The line conforms to:
y = a + bx
where:
a = 0.45544384965539358 b = 0.14454244707261443
The line predicts that if a genome were to consist entirely of G+C (guanine and cytosine), it would be 45.54% guanine, whereas if (in some mythical creature) the genome were to consist entirely of A+T (adenine and thymine), adenine would comprise 59.99% of the DNA. Interestingly, the 95% confidence interval permits a value of 0.61803 at X = 1.0, which would mean that as guanine and cytosine diminish to zero, A/T approaches the Golden Ratio.
Do the most primitive bacteria (Archaea) also obey this relationship? Yes, they do. In preparing the graph below, I analyzed codon usage in 122 Archaeal genera to obtain A, G, T, and C relative proportions in coding regions of genes. As you can see, the same basic relationship exists between purine content and A+T in Archaea as in Eubacteria. Regression analysis yielded a line with a slope of 0.16911 and a vertical offset 0.45865. So again, it's possible (or maybe it's just a very strange coincidence) that A/T approaches the Golden Ratio as A+T approaches unity.
![]() |
| Analysis of coding regions in 122 Archaea reveals that the same relationship exists between A+T content and purine mole-fraction (A+G) as exists in eubacteria. |
![]() |
| Eukaryotic organisms (N=114). |
Mitochondria and chloroplasts (see the two graphs below) show a good bit more scatter in the data, but regression analysis still comes back with positive slopes (0.06702 and .13188, respectively) for the line of least squared absolute error.
|
|
|
|
The fact that viral nucleic acids follow the same purine trajectories as their hosts perhaps shouldn't come as a surprise, because viral genetic material is (in general) highly adapted to host machinery. Purine loading appropriate to the A+T milieu is just another adaptation.
It's striking that so many genomes, from so many diverse organisms (eubacteria, archaea, eukaryotes, viruses, bacteriophages, plus organelles), follow the same basic law of approximately
A+G = 0.46 + 0.14 * (A+T)
The above law is as universal a law of biology as I've ever seen. The only question is what to call the slope term. It's clearly a biological constant of considerable significance. Its physical interpretation is clear: It's the rate at which purines are accumulated in mRNA as genome A+T content increases. It says that a 1% increase in A+T content (or a 1% decrease in genome G+C content) is worth a 0.14% increase in purine content in message strands. Maybe it should be called the purine rise rate? The purine amelioration rate?
Biologists, please feel free to get in touch to discuss. I'm interested in hearing your ideas. Reach out to me on LinkedIn, or simply leave a comment below.
Tuesday, May 28, 2013
Chargaff's Second Parity Rule is Broadly Violated
Erwin Chargaff, working with sea-urchin sperm in the 1950s, observed that within double-stranded DNA, the amount of adenine equals the amount of thymine (A = T) and guanine equals cytosine (G = C), which we now know is the basis of "complementarity" in DNA. But Chargaff later went on to observe the same thing in studies of single-stranded DNA, causing him to postulate that A = T and G = C more generally (within as well as across strands of DNA). The more general postulation is known as Chargaff's second parity rule. It says that A = T and G = C within a single strand of DNA.
The second parity rule seemed to make sense, because there was and is no a priori reason to think that DNA or RNA, whether single-stranded or double-stranded, should contain more purines than pyrimidines (nor vice versa). All other factors being equal, nature should not "favor" one class of nucleotide over another. Therefore, across evolutionary times frames, one would expect purine and pyrimidine prevalences in nucleic acids to equalize.
What we instead find, if we look at real-world DNA and RNA, is that individual strands seldom contain equal amounts of purines and pyrimidines. Szybalski was the first to note that viruses (which usually contain single-stranded nucleic acids) often contain more purines than pyrimidines. Others have since verified what Szybalski found, namely that in many organisms, DNA is purine-heavy on the "sense" strand of coding regions, such that messenger RNA ends up richer in purines than pyrimidines. This is called Szybalski's rule.
In a previous post, I presented evidence (from analysis of the sequenced genomes of 93 bacterial genera) that Szybalski's rule not only is more often true than Chargaff's second parity rule, but in fact purine-loading of coding region "message" strands occurs in direct proportion to the amount of A+T (or in inverse propoertion to the amount of G+C) in the genome. At G+C contents below about 68%, DNA becomes heavier and heavier with purines on the message strand. At G+C contents above 68%, we find organisms in which the message strand is actually pyrimidine-heavy instead of purine-heavy.
I now present evidence that purine loading of message strands in proportion to A+T content is a universal phenomenon, applying to a wide variety of eukaryotic ("higher") life forms as well as bacteria.
To create the accompanying graph, I did frequency analysis of codons for 58 eukaryotic life forms (pink data points) and 93 prokaryotes (dark green data points) in order to derive prevalences of the four bases (A, G, C, T) in coding regions of DNA. Eukaryotes that were studied included yeast, molds, protists, warm and cold-blooded animals, flowering and non-flowering plants, alga, and insects and crustaceans. The complete list of organisms is shown in a table further below.
It can now be stated definitively that Chargaff's second parity rule is, in general, violated across all major forms of life. Not only that, it is violated in a regular fashion, such that purine loading of mRNA increases with genome A+T content. Significantly, some organisms with very low A+T content (high G+C content) actually have pyrimidine-loaded mRNA, but they are in a small minority.
Purine loading is both common and extreme. For about 20% of organisms, the purine-pyrimidine ratio is above 1.2. For some organisms, the purine excess is more than 40%, which is striking indeed.
Why should purines migrate to one strand of DNA while pyrimidines line up on the other strand? One possibility is that it minimizes spontaneous self-annealing of separated strands into secondary structures. Unrestrained "kissing" of intrastrand regions during transcription might lead to deleterious excisions, inversions, or other events. Poly-purine runs would allow the formation of many loops but few stems; in general, secondary structures would be rare.
The significance of purine loading remains to be elucidated. But in the meantime, there can be no doubt that purine enrichment of message strands is indeed widespread and strongly correlates to genome A+T content. Chargaff's second parity rule is invalid, except in a trivial minority of cases.
The prokaryotic organisms used in this study were presented in a table previously. The eukaryotic organisms are shown in the following table:
The second parity rule seemed to make sense, because there was and is no a priori reason to think that DNA or RNA, whether single-stranded or double-stranded, should contain more purines than pyrimidines (nor vice versa). All other factors being equal, nature should not "favor" one class of nucleotide over another. Therefore, across evolutionary times frames, one would expect purine and pyrimidine prevalences in nucleic acids to equalize.
What we instead find, if we look at real-world DNA and RNA, is that individual strands seldom contain equal amounts of purines and pyrimidines. Szybalski was the first to note that viruses (which usually contain single-stranded nucleic acids) often contain more purines than pyrimidines. Others have since verified what Szybalski found, namely that in many organisms, DNA is purine-heavy on the "sense" strand of coding regions, such that messenger RNA ends up richer in purines than pyrimidines. This is called Szybalski's rule.
In a previous post, I presented evidence (from analysis of the sequenced genomes of 93 bacterial genera) that Szybalski's rule not only is more often true than Chargaff's second parity rule, but in fact purine-loading of coding region "message" strands occurs in direct proportion to the amount of A+T (or in inverse propoertion to the amount of G+C) in the genome. At G+C contents below about 68%, DNA becomes heavier and heavier with purines on the message strand. At G+C contents above 68%, we find organisms in which the message strand is actually pyrimidine-heavy instead of purine-heavy.
I now present evidence that purine loading of message strands in proportion to A+T content is a universal phenomenon, applying to a wide variety of eukaryotic ("higher") life forms as well as bacteria.
To create the accompanying graph, I did frequency analysis of codons for 58 eukaryotic life forms (pink data points) and 93 prokaryotes (dark green data points) in order to derive prevalences of the four bases (A, G, C, T) in coding regions of DNA. Eukaryotes that were studied included yeast, molds, protists, warm and cold-blooded animals, flowering and non-flowering plants, alga, and insects and crustaceans. The complete list of organisms is shown in a table further below.
It can now be stated definitively that Chargaff's second parity rule is, in general, violated across all major forms of life. Not only that, it is violated in a regular fashion, such that purine loading of mRNA increases with genome A+T content. Significantly, some organisms with very low A+T content (high G+C content) actually have pyrimidine-loaded mRNA, but they are in a small minority.
Purine loading is both common and extreme. For about 20% of organisms, the purine-pyrimidine ratio is above 1.2. For some organisms, the purine excess is more than 40%, which is striking indeed.
Why should purines migrate to one strand of DNA while pyrimidines line up on the other strand? One possibility is that it minimizes spontaneous self-annealing of separated strands into secondary structures. Unrestrained "kissing" of intrastrand regions during transcription might lead to deleterious excisions, inversions, or other events. Poly-purine runs would allow the formation of many loops but few stems; in general, secondary structures would be rare.
The significance of purine loading remains to be elucidated. But in the meantime, there can be no doubt that purine enrichment of message strands is indeed widespread and strongly correlates to genome A+T content. Chargaff's second parity rule is invalid, except in a trivial minority of cases.
The prokaryotic organisms used in this study were presented in a table previously. The eukaryotic organisms are shown in the following table:
| Organism | Comment | G+C% | Purine ratio |
| Chlorella variabilis strain NC64A | endosymbiont of Paramecium | 68.76 | 1.1055181128896376 |
| Chlamydomonas reinhardtii strain CC-503 cw92 mt+ | unicellular alga | 67.96 | 1.0818749999999997 |
| Micromonas pusilla strain CCMP1545 | unicellular alga | 67.41 | 1.1873268193087356 |
| Ectocarpus siliculosus strain Ec 32 | alga | 62.74 | 1.2090728330510347 |
| Sporisorium reilianum SRZ2 | smut fungus | 62.5 | 0.9776547360094916 |
| Leishmania major strain Friedlin | protozoan | 62.47 | 1.0325 |
| Oryza sativa Japonica Group | rice | 54.77 | 1.0668412348401317 |
| Takifugu rubripes (torafugu) | fish | 54.08 | 1.0655094027691674 |
| Aspergillus fumigatus strain A1163 | fungus | 53.89 | 1.013091641490433 |
| Sus scrofa (pig) | pig | 53.77 | 1.0680595779892428 |
| Drosophila melanogaster (fruit fly) | 53.69 | 1.0986989367655287 | |
| Brachypodium distachyon line Bd21 | grass | 53.32 | 1.0764746703677999 |
| Selaginella moellendorffii (Spikemoss) | moss | 52.83 | 1.1014492753623195 |
| Equus caballus (horse) | horse | 52.29 | 1.0844453711426192 |
| Pongo abelii (Sumatran orangutan) | orangutan | 52 | 1.0929015146227405 |
| Homo sapiens | human | 51.97 | 1.0939049081896255 |
| Mus musculus (house mouse) strain mixed | mouse | 51.91 | 1.0827720297201582 |
| Tuber melanosporum (Perigord truffle) strain Mel28 | truffle | 51.4 | 1.0836820083682006 |
| Phaeodactylum tricornutum strain CCAP 1055/1 | diatom | 51.06 | 1.0418452745458253 |
| Arthroderma benhamiae strain CBS 112371 | fungus | 50.99 | 1.0360268674944024 |
| Ornithorhynchus anatinus (platypus) | platypus | 50.97 | 1.1121909993661525 |
| Taeniopygia guttata (Zebra finch) | bird | 50.81 | 1.1344717182497328 |
| Trypanosoma brucei TREU927 | sleeping sickness protozoan | 50.78 | 1.106974784013486 |
| Danio rerio (zebrafish) strain Tuebingen | fish | 49.68 | 1.1195053003533566 |
| Gallus gallus | chicken | 49.54 | 1.1265418970650787 |
| Monodelphis domestica (gray short-tailed opossum) | opossum | 49.07 | 1.0768110918544194 |
| Sorghum bicolor (sorghum) | sorghum | 48.93 | 1.046422719825232 |
| Thalassiosira pseudonana strain CCMP1335 | diatom | 47.91 | 1.1403183213189638 |
| Hyaloperonospora arabidopsis | mildew | 47.75 | 1.053039546400631 |
| Daphnia pulex (common water flea) | water flea | 47.57 | 1.058036633052068 |
| Physcomitrella patens subsp. patens | moss | 47.33 | 1.1727134477514667 |
| Anolis carolinensis (green anole) | lizard | 46.72 | 1.113765477057538 |
| Brassica rapa | flowering plant | 46.29 | 1.1056659411640803 |
| Fragaria vesca (woodland strawberry) | strawberry | 46.02 | 1.1052853232259425 |
| Amborella trichopoda | flowering shrub | 45.88 | 1.0992441209406494 |
| Citrullus lanatus var. lanatus (watermelon) | watermelon | 44.5 | 1.0855134984692458 |
| Capsella rubella | mustard-family plant | 44.37 | 1.1041257367387034 |
| Arabidopsis thaliana (thale cress) | cress | 44.15 | 1.109853013573388 |
| Lotus Japonicus | lotus | 44.11 | 1.0773228019122847 |
| Populus trichocarpa (Populus balsamifera subsp. trichocarpa) | tree | 43.7 | 1.1097672456226706 |
| Cucumis sativus (cucumber) | cucumber | 43.56 | 1.0823847862298719 |
| Caenorhabditis elegans strain Bristol N2 | worm | 42.96 | 1.106320224719101 |
| Vitis vinifera (grape) | grape | 42.75 | 1.0859833393697935 |
| Ciona intestinalis | tunicate | 42.68 | 1.158652461848546 |
| Solanum lycopersicum (tomato) | tomato | 41.7 | 1.1177 |
| Theobroma cacao (chocolate) | chocolate | 41.31 | 1.1297481860862142 |
| Medicago truncatula (barrel medic) strain A17 | flowering plant | 40.78 | 1.093754366354618 |
| Apis mellifera (honey bee) strain DH4 | honey bee | 39.76 | 1.216042543762464 |
| Saccharomyces cerevisiae (bakers yeast) strain S288C | yeast | 39.63 | 1.1387641650630744 |
| Acyrthosiphon pisum (pea aphid) strain LSR1 | aphid | 39.35 | 1.1651853457619772 |
| Debaryomyces hansenii strain CBS767 | yeast | 37.32 | 1.1477345930856775 |
| Pediculus humanus corporis (human body louse) strain USDA | louse | 36.57 | 1.2365791828213537 |
| Schistosoma mansoni strain Puerto Rico | trematode | 35.94 | 1.0586902800658977 |
| Candida albicans strain WO-1 | yeast | 35.03 | 1.1490291609944834 |
| Tetrapisispora phaffii CBS 4417 strain type CBS 4417 | yeast | 34.69 | 1.17503805175038 |
| Paramecium tetraurelia strain d4-2 | protist | 30.03 | 1.2494922903347117 |
| nucleomorph Guillardia theta | endosymbiont | 23.87 | 1.1529462427330803 |
| Plasmodium falciparum 3D7 | malaria parasite | 23.76 | 1.4471365638766511 |
Subscribe to:
Posts (Atom)


.png)

.png)
.png)